It was another uneventful week for the Canadian dollar as USD/CAD was unchanged. The pair closed the week at the 1.23 line. The upcoming week has just two events, but the GDP release could have a strong effect on the movement of USD/CAD. Here is an outlook on the major market-movers and an updated technical analysis for USD/CAD.
In the US housing numbers were strong, and the week ended with excellent consumer sentiment data. Still, US Final GDP declined by 0.2%, matching the forecast. There were no Canadian economic releases last week.
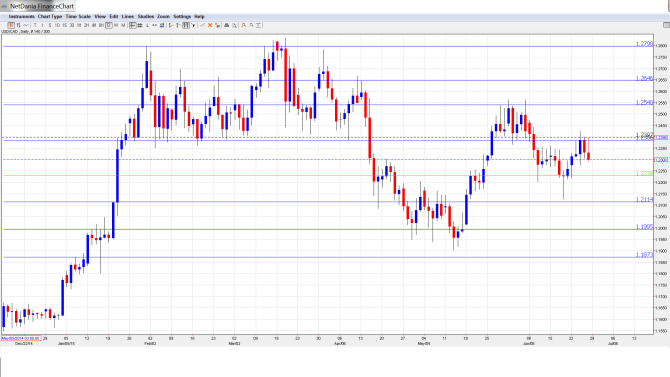
[do action=”autoupdate” tag=”USDCADUpdate”/]USD/CAD daily chart with support and resistance lines on it. Click to enlarge:
- RMPI: Monday, 12:30. RMPI is the primary gauge of inflation in the manufacturing sector. The index tends to show a lot of volatility, often leading to readings that are well off the estimates. In April, the indicator bounced back with a sharp gain of 3.8%, easily beating the forecast of 1.7%. Will the indicator repeat with another strong release?
- GDP: Tuesday, 12:30. GDP is one of the most important economic indicators, and traders should treat it as a market-mover. Canada releases GDP on a monthly basis, unlike most other developed economies which publish the indicator each quarter. The indicator has struggled, posting just one gain in 2014. The indicator declined by 0.2% in March, shy of the estimate of +0.2%. The markets are expecting better news in the April report, with an estimate of +0.1%.
* All times are GMT.
USD/CAD Technical Analysis
USD/CAD opened the week at 1.2275 and quickly dropped to a low of 1.2218, testing support at 1.2230 (discussed last week). The pair then reversed directions, climbing to a high of 1.2423. USD/CAD closed the week at 1.2300.
Live chart of USD/CAD: [do action=”tradingviews” pair=”USDCAD” interval=”60″/]
Technical lines, from top to bottom
1.2798 has remained intact since mid-March.
1.2646 is the next resistance line.
1.2541 has provided an important cap in June.
1.2386 remains an immediate support level.
1.2230 was tested in support for a second straight week as USD/CAD softened early in the week before recovering.
1.2114 is a strong support level.
1.1995 is situated just below the symbolic 1.20 level. This line has remained intact since mid-May.
1.1873 is the final support level for now.
I am bullish on USD/CAD
The FOMC may be slightly more hawkish than perceived, as a Fed policymaker spoke of one or even two rate hikes in 2015. If there are further hints about a rate hike, the greenback could jump higher. Over in Canada, GDP has struggled, and a weaker than expected reading could hurt the loonie.
In our latest podcast, we discuss building on the US recovery, the Greek crisis and EUR, Saudi solar and next week’s events.
Follow us on Stitcher.
Further reading:
- For a broad view of all the week’s major events worldwide, read the USD outlook.
- For EUR/USD, check out the Euro to Dollar forecast.
- For the Japanese yen, read the USD/JPY forecast.
- For GBP/USD (cable), look into the British Pound forecast.
- For the Australian dollar (Aussie), check out the AUD to USD forecast.
- For the kiwi, see the NZDUSD forecast.
