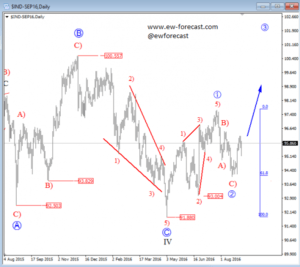
On USD index daily chart we can see a big sideways pattern since the start of 2015; A slow and overlapping price action with a personality of a contra-trend movement that looks completed. We see it as a flat correction in black wave IV; a three wave structure where the final wave C should be made by five waves. Well, we have seen a nice decline from November of 2015 counted in five legs, but as an ending diagonal. That’s a reversal pattern that already caused a strong bounce in May, so ideally the recent sharp leg down was just a temporary pullback labeled as blue wave two within this ongoing uptrend.
That said, we are now looking at a bullish scenario, with more upside to follow. Ideally, the corrective wave 2 has found its support around the 61.8 Fibonacci region and made a new reversal higher into blue wave 3.
USD Index, Daily
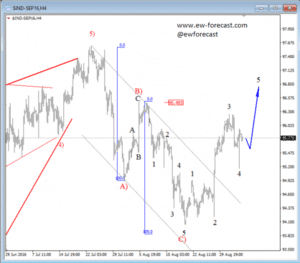
On the 4h chart, we can see that USD index turned up in the last two weeks and took out the upper trendline resistance of a downward channel that can be one of the most important bullish evidences. As such, we are looking at a completed A)-B)-C) decline now followed by a new bullish impulse in progress. If that’s correct, then we can expect further gains up into wave 5 towards the 96.50 as the recent fourth wave down can already be finished.
USD Index, 4H