EURUSD Daily Analysis
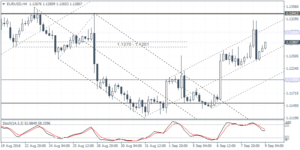
EURUSD (1.1280): EURUSD attempted to breakout above $1.1300 resistance level, but prices were met with strong resistance. At the time of writing, EURUSD is attempting to test the resistance once more, but it is hard to expect any meaningful gains as the resistance level could be hard to break on no fundamental catalysts. On the 4-hour chart, the current retracement of yesterday’s declines to 1.1250 could be seen with the bearish divergence that is currently forming. Support at 1.1200 is quite likely to be tested on a lower high being formed.
USDJPY Daily Analysis
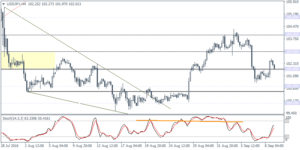
USDJPY (102.01): USDJPY managed to close above 102.00 resistance yesterday, but the close above this resistance does not look very convincing. The near-term pullback is likely to see USDJPY remain trading within the 101.00 – 102.00 price zone. There is still a risk of USDJPY falling towards the 101.00 – 100.80 support level that has been mentioned previously. From the current price action, USDJPY is likely to complete its declines near the support ahead of further gains that can be seen coming.
GBPUSD Daily Analysis
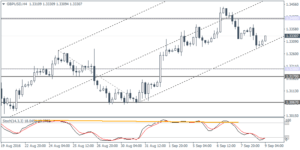
GBPUSD (1.3330): GBPUSD continues to remain trading within the inside bar that was formed two days ago. In the near term, the current retracement could see a test of $1.3400 ahead of further declines to test the $1.3200 support. This view is validated by the 4-hour chart where we see GBPUSD bouncing off the lower median line. Forming a lower high near 1.3400 could confirm the bearish view. Watch the Stochastics which is currently in the oversold area for posting a lower high which could see the bearish divergence being in play. A daily close above $1.3400 could put the downside bias at risk.
Gold Daily Analysis
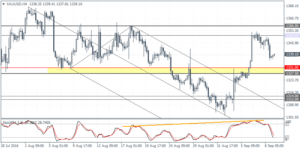
XAUUSD (1339.10): Gold prices posted two straight days of declines after testing the $1350 resistance level. Support is now seen at $1330 in the near term. The previous minor support at $1315 – $1300 will be key as a breakdown below this support is essential to see further declines in price. Alternately, bounce off the $1330 – $1327.50 support from the 4-hour chart could see the potential inverse head and shoulders evolve which could see gold prices turn bullish if price manages to break out above the $1350 – $1360 neckline resistance.
