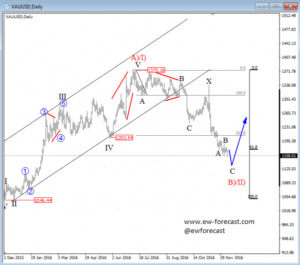
On the daily chart of gold we see a bullish pattern; a five-wave up from November 2015 low followed by a turn down from 1375 that we view as a corrective move because of overlaps. Based on the latest price data, we are tracking a double zigzag that can be headed towards the 1180 area where buyers will try to cause a turn. Technically speaking, we see this market in bullish mode as long as 1046 is not taken out.
GOLD, Daily
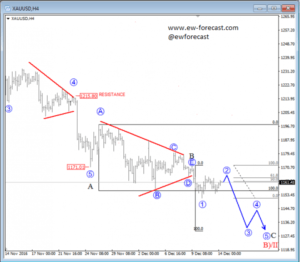
Gold is moving sharply lower, away from 1337 swing high where the market found a top of wave X that belongs to a big complex decline, as shown on a daily chart. So, we are tracking a double zigzag which should now see more weakness, as sub-wave B is considered a completed triangle on the 4h chart. As we see more weakness may be now in play for wave C of B)/II) as the price made a nice drop towards the 1154 level, labeled as sub-wave 1-circled, followed by a recent bounce labeled as wave 2-circled. That said, the price will ideally continue to the downside within the final wave C, and make a possible reversal near the Fibonacci ratio of 100.0, where the measurement of equality comes in play.
GOLD, 4H