- The AUD/USD enjoyed the rise of metals but suffered from disappointing employment and rising US yields.
- The inflation report is left, right, and center in the last full week of April.
- The technical behavior of the pair looks excellent as it was rejected from a confluence of levels.
Metals give, USD yields take
Metals are rocking: The price of aluminum, subject to Trump’s tariffs,shot higher. Complications created by the tariffs and sanctions on Russia pushed this primary industrial metal higher. Nickel and then other commodities that Australia exports also moved to the upside, providing lots of support to the pair. The movements in these often overlooked instruments were massive.
Disappointing jobs report: Australia reported a gain of only 4,900 jobs in March, significantly below 21,00 that had been expected. The Unemployment Rate dropped from 5.6% to 5.5%, but that came on top of a drop in the Participation Rate. Perhaps the worst part comes from the composition: a fall in full-time positions and rises in part-time ones.
US Dollar awakens on yields: In the US, Retail Sales were mixed and mainly in line with expectations while housing figures advanced nicely. Fed officials led by Williams came out with optimistic and relatively hawkish messages. The US Dollar took its time to react and waited for US Treasury Yields to climb above 2.90% to finally make a move. The AUD/USD was one of the most impacted by Thursday’s bond rout.
Australian events: Inflation and more metal moves
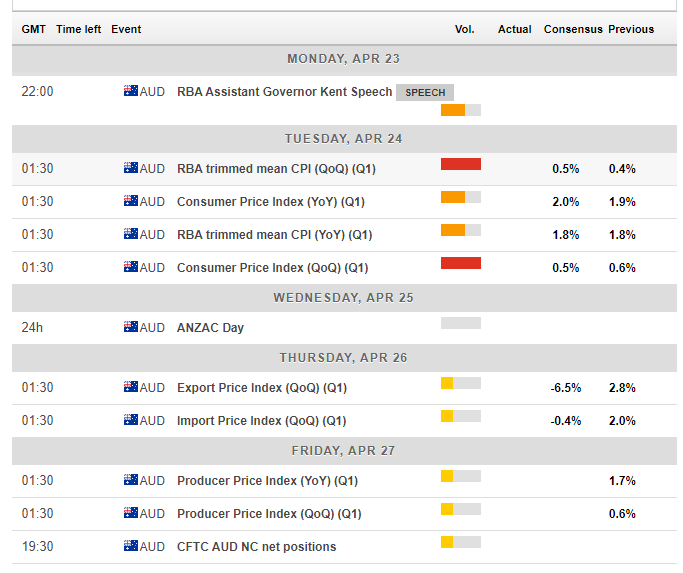
Prices of metals and especially Australia’s primary exports, iron, and copper will continue to be of interest. The high volatility is felt in the Aussie. Among the scheduled events, the inflation report on Tuesday stands out. Australia publishes price data only once per quarter, making the impact quite significant. In the last quarter of 2017, headline Consumer Price Index rose by 0.6% QoQ and 1.9% YoY. The Trimmed Mean figure (called Core CPI elsewhere) rose by a more modest 0.4% QoQ and 1.8% YoY.
As the RBA is firmly on hold, an outstanding deviation from the current YoY levels of around 2% would be needed to sway them to either direction.
Australia enjoys the ANZAC Day holiday on Wednesday before other figures come out. Thursday sees the Export Price Index which rose by 2.8% in Q4 2017. The Producer Price Index (PPI) is published on Friday. It used to have a more substantial impact when it was released before the CPI. Nevertheless, with YoY rises of only 1.7% recorded in Q4 2017, markets will want to see an increase in Q1 2018.
Here are the events that will shape the Australian dollar as they appear on the economic calendar:
US events: GDP Buildup
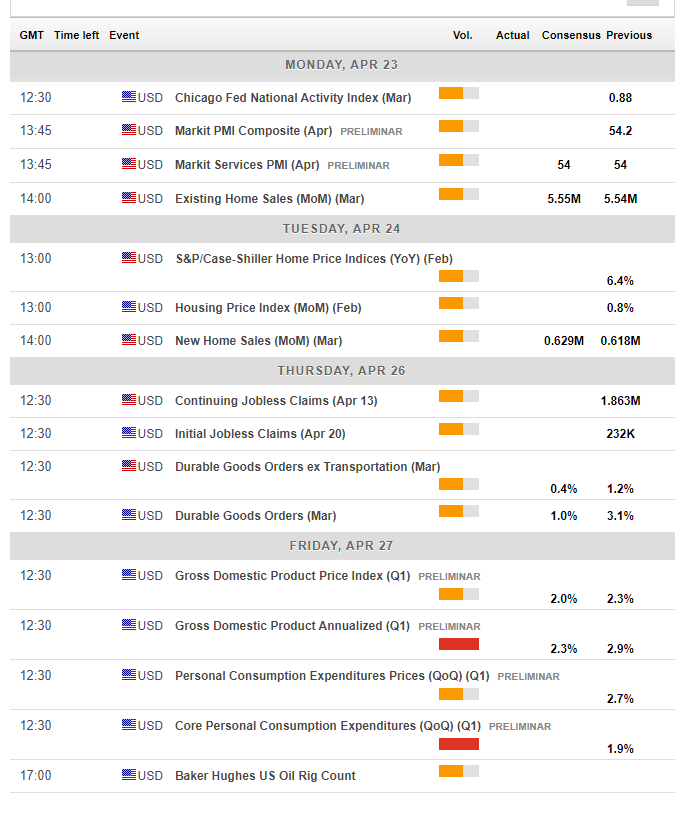
The leading US economic indicator is published on Friday. The world’s No. 1 economy releases its first estimate for Q1 and expectations are for a slowdown to 2.3% annualized, down from 2.9% seen in Q4 2017. The US economy frequently suffers from a slow start to the year. Surprises are quite frequent in the initial estimate.
Beforehand, Existing Home Sales on Monday and New Home Sales on Tuesday will give further insight into the housing sector, which looks upbeat at the moment. A hint towards the GDP report comes on Thursday with the release of Durable Goods Orders for March. A slower rate of rises is projected. The data feeds into GDP.
In Washington, any comment by President Trump or his Administration about trade issues will have an effect on markets and the sensitive Australian Dollar. The Australian economy needs a global trade to flourish.
Here are the upcoming US events:
AUD/USD Technical Analysis – the perfect rejection
The A$0.7820 level was the confluence of a double-top, the 200-day Simple Moving Average and also the downtrend resistance in the channel. This trifecta of lines capped the pair and remains a crucial line of resistance.
The RSI, which was hovering above the 50 line is now back to balanced, and upside Momentum is petering out. The pair also lost the 50-day SMA.
0.7650 was the trough in mid-March and the pair approached it in April. Further down, 0.7550 was a stepping stone on the way up in December and it is followed by the very round level of 0.7500, where the uptrend of early 2018 all began.
On the topside, 0.7710 capped the pair during March. 0.7740 provided support in early April. The mid-March high of 0.7790 works as a stepping stone before the 0.7820 level mentioned above. Even higher, 0.7840 was a cap in February,
-636598311381980491.png)
What’s next for AUD/USD?
The Australian dollar is pushed and pulled from all directions. The most important factor remains the RBA. If they do not raise rates this year, there is more room to the downside even when not considering trade issues, the Fed, and other factors that may weigh on the pair.
The FXStreet Forecast Poll shows that analysts are decidedly bearish in the short and medium term while bullish later on. The views for the nearer terms echoes the sentiment expressed here.
More: Trading forex in Europe? This is what the new ESMA regulations mean for you
