- Chinese Manufacturing Index: Sunday, 1:00. The manufacturing sector was stagnant for a second straight month, with a reading of 50.6 in May. The 50.0 level separates contraction from expansion.
- AIG Manufacturing Index: Sunday, 22:30. The Australian Industry Group index dropped sharply, from 53.8 in March to 35.8 in April. Will we see another contraction in April?
- MI Inflation Gauge: Monday, 1:00. The Melbourne Institute inflation indicator provides analysts with a monthly read on inflation levels. In April, inflation fell by 0.1%, its second decline in the past three months. We now await the May release.
- Current Account: Tuesday, 1:30. The economic crunch sent the current account surplus sharply lower in Q4, with a reading of AUD 1.0 billion. This missed the forecast of AUD 2.3 billion. However, the surplus is expected to rebound sharply in Q1 of 2020, with an estimate of AUD 6.0 billion.
- RBA Rate Decision: Tuesday, 5:30. After slashing the cash rate to 0.25%, the RBA hasn’t touched rates since March. No change is projected at the upcoming meeting. A dovish message in the rate statement could weigh on the Aussie.
- AIG Construction Index: Tuesday, 22:30. The construction sector has been devastated by the economic meltdown, as the index plunged to 21.6 in April, down from 37.9 in the previous release. Will the downturn continue in May?
- GDP: Wednesday, 1:30. GDP ticked up to 0.5% in Q4, up from 0.4% in the previous quarter. Analysts are bracing for a dismal first quarter, with a forecast of -0.4 percent.
- Retail Sales: Thursday, 1:30. Consumer spending plunged in March, as retail sales fell by some 17.9 percent. An identical figure is projected for April.
- Trade Balance: Thursday, 1:30. Australia’s trade surplus jumped to AUD 10.60 billion in March, crushing the forecast of AUD 6.40 billion. The surplus is expected to slip to AUD 7.50 billion in April.
- AIG Services Index: Thursday, 22:30. The services index continues to fall sharply and fell to 27.1 in April, pointing to sharp contraction. We’re likely to see another significant contraction in May.
.
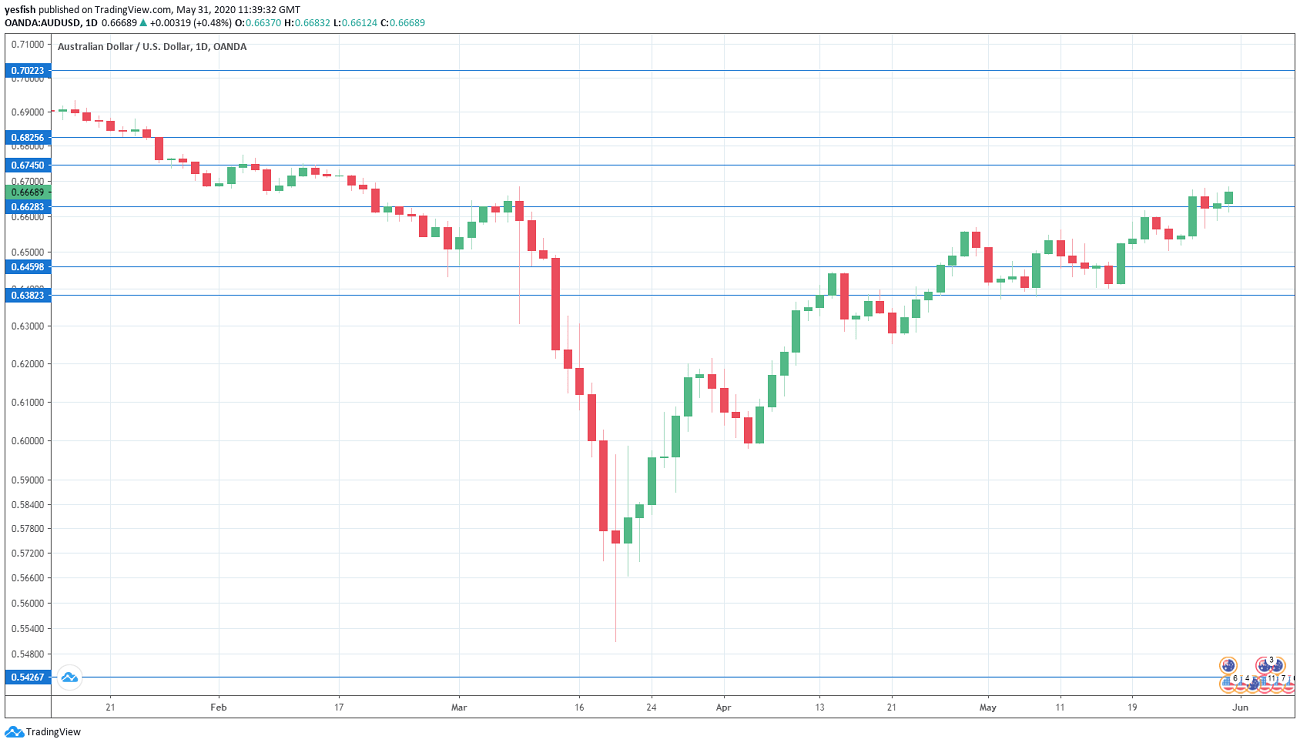
AUD/USD Technical Analysis
Technical lines from top to bottom:
With AUD/USD posting strong gains last week, we begin at higher levels:
We start with resistance at 0.7022.
0.6960 is protecting the 0.70 line, which has psychological significance.
0.6825 supported the pair in late 2016 and early 2017.
0.6744 was a low point in January.
0.6627 has held in resistance since early March.
0.6560 is an immediate resistance line.
0.6456 is providing support.
0.6380 (mentioned last week) was tested in the first week of May. It is the final support level for now.
.
