The Australian dollar struggled to recover and the RBA did not help too much. The main event for the upcoming week is the capital expenditure report. Will the Aussie bounce? Here are the highlights of the week and an updated technical analysis for AUD/USD.
The RBA meeting minutes were somewhat dovish and sent the Aussie to lower ground. The A$ managed to recover mostly thanks to the fall of the dollar, due to the Fed’s own concerns about inflation. The Aussie also managed to bounce on alongside a leap in the amount of construction work done: 15.7% in Q3.
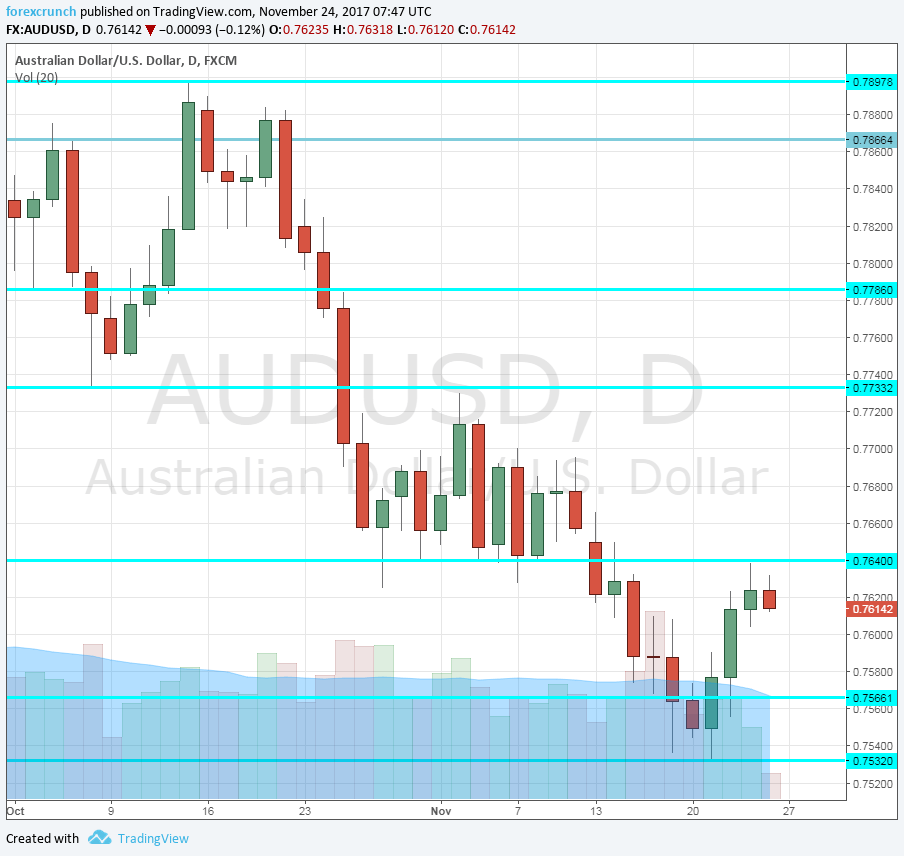
[do action=”autoupdate” tag=”AUDUSDUpdate”/]AUD/USD daily graph with support and resistance lines on it. Click to enlarge:
- HIA New Home Sales: Thursday, 00:00. The Housing Industry Association’s figures are quite volatile but are still eyed. A drop of 6.1% was seen in October after a bigger increase beforehand.
- Private Capital Expenditure: Thursday, 00:30. The level of private capital expenditure is closely watched by the Reserve Bank of Australia as an indicator of future growth. After quite a few quarters of shrinking investment due to the “end of the mining boom”, expenditure has picked up in 2017, rising by 0.9% in Q1 and 0.8% in Q2. Will the positive momentum continue into Q3? An increase of 1.1% is projected.
- Building Approvals: Thursday, 00:30. Similar to the HIA figure, also this housing sector is somewhat volatile. The number of approvals has climbed in September by 1.5%, defying expectations. A slide of 0.9% is forecast.
- Private Sector Credit: Thursday, 00:30. After a few months of steady growth in credit, September saw a slower rise than in previous months: only 0.3% against 0.5% in the previous two months. Any expansion of credit implies growth. A rate of 0.4% is on the cards now.
- Chinese Manufacturing PMI: Thursday, 1:00. This official measure of the Chinese manufacturing sector dropped to 51.6 points in October, below expectations. China is Australia’s No. 1 trade partner and the manufacturing sector in the economic giant influences Australia’s commodity exports. A score of 51.5 is expected.
- AIG Manufacturing Index: Thursday, 22:30. This indicator for the manufacturing sector dropped sharply in the past two months, hitting 51.1 points in October. Another drop and it may find itself in contraction territory.
- Chinese Caixin Manufacturing PMI: Friday, 1:45. The independent gauge for China’s manufacturing sector is eyed by many. It met expectations in October by standing at 51 points. A similar number is likely now. A small rise to 51.2 is estimated.
- Commodity Prices: Friday, 5:30. The indicator is relevant to Australia’s metal exports even if the higher frequency changes in copper and iron prices play a bigger role. The annual rises in prices have diminished and reached 9.1% in October.
AUD/USD Technical Analysis
The Aussie struggled to recapture the 0.7565 level (mentioned last week) but recovered from there.
Technical lines from top to bottom:
The psychological round level of 0.80. Below, we find 0.7940, which capped the pair in August.
0.7860 served as support during September and is another line to watch. 0.7785 was a stepping stone on the way up.
Below, we find 0.7730, that was a high point in June 2017 and also beforehand, working as resistance in November. 0.7640 worked as resistance in November.
Even lower, we find 0.7565 was a low point before the pair shot higher in July. The cycle low is 0.7515.
Even lower, we find 0.7440 and then 0.7375.
I remain bearish on AUD/USD
Things are not looking so positive for Australia and the central bank seems keen to encourage the fall of the Aussie.
Our latest podcast is titled German gyrations + nature and natural gas
Follow us on Sticher or iTunes
Further reading:
- EUR/USD forecast – for everything related to the euro.
- GBP/USD forecast – Pound/dollar predictions
- USD/JPY forecast – projections for dollar/yen
- USD/CAD forecast – Canadian dollar analysis
- Forex weekly forecast – Outlook for the major events of the week.
Safe trading!
