AUD/USD extended its slide toward 0.6900 after Australia reported an increase in the unemployment rate: 5.2% against 5% expected. What levels should we watch on the Aussie dollar?
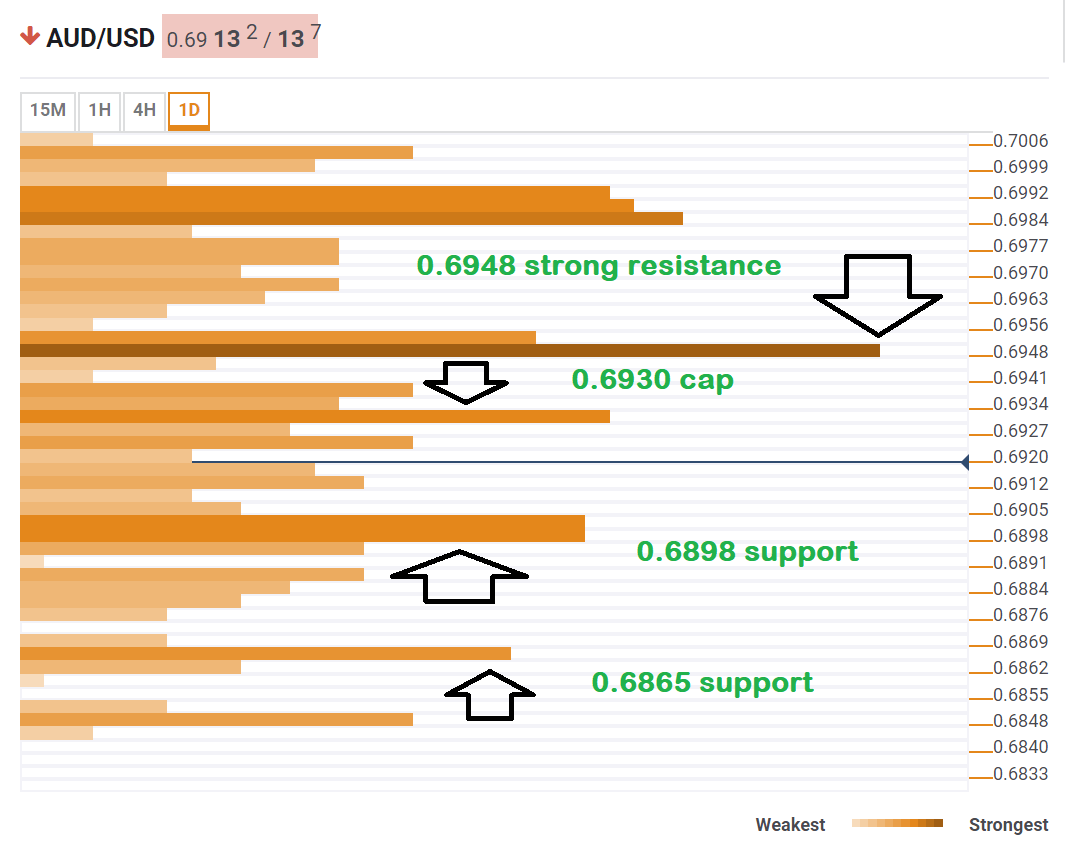
The Technical Confluences Indicator shows that AUD/USD may find support around 0.6898 where we see the convergence of the Bollinger Gand one-day Lower, the Pivot Point one-day Support 2, and PP one-week S2.
The next cushion is somewhat weaker at 0.6865 where the PP one-month S1 awaits.
Looking up, resistance is quite substantial. Initial resistance awaits at 0.6930 which is the confluence of the Fibonacci 38.2% one-day and the Simple Moving Average 10-4h.
The most significant cap is close. At 0.6948 we see a dense cluster including the BB 4h-Middle, the PP one-day R1, the PP one-week S1, and the previous daily high.
All in all, the path of least resistance is to the downside.
Here is how it looks on the tool:
Confluence Detector
The Confluence Detector finds exciting opportunities using Technical Confluences. The TC is a tool to locate and point out those price levels where there is a congestion of indicators, moving averages, Fibonacci levels, Pivot Points, etc. Knowing where these congestion points are located is very useful for the trader, and can be used as a basis for different strategies.
This tool assigns a certain amount of “weight” to each indicator, and this “weight” can influence adjacents price levels. These weightings mean that one price level without any indicator or moving average but under the influence of two “strongly weighted” levels accumulate more resistance than their neighbors. In these cases, the tool signals resistance in apparently empty areas.
