- Australian inflation has hit a 21-year high.
- Inflation in Australia is expected to keep rising.
- In the charts, the price is experiencing support at the 30-SMA.
Today’s AUD/USD price analysis is bullish after yesterday’s data showed Australia’s inflation at a 21-year high. Price rises are being driven by the higher costs of fuel and food. The country’s treasurer, Jim Chalmers, is expected to update the government’s budget forecasts and is already warning of worsening inflation.
–Are you interested to learn more about forex options trading? Check our detailed guide-
“It will be confronting,” Chalmers told reporters in the update. “Inflation revised substantially, growth revised down, and all of the implications that brings.”
The Australian Bureau of Statistics reported an annual inflation rate of 6.1%, up from a previous 5.1%, the highest value since 2001. Core inflation was up 1.5% in the quarter, raising the annual pace to the highest since 2003. This has removed inflation further from the Reserve Bank of Australia’s 2-3% target.
Markets expect the central bank’s policy to get tighter as it tries to rein in hot inflation. However, how fast or how much the bank will raise rates is still unclear.
“The challenge now is calibrating the amount of tightening that will be needed,” said Paul Bloxham, head of Australian economics at HSBC, noting “neutral” was a moving target and tough to hit in practice.
“Going too hard from here may deliver a recession-too little, a persistent inflation problem,” he warned. “A narrow pathway indeed.”
AUD/USD key events today
AUD/USD Investors will pay attention to the FOMC meeting, where the Fed is expected to raise rates by 75bps. There will also be a retail sales report from Australia that is expected to show a 0.4% drop from May.
AUD/USD technical price analysis: A break below the 30-SMA to confirm the bearish divergence.
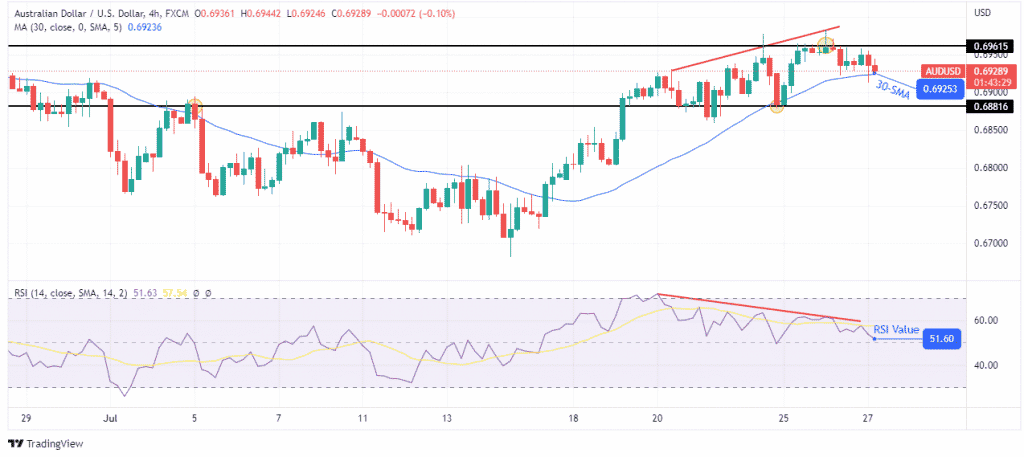
Looking at the 4-hour chart, we see the price at the 30-SMA after finding resistance at 0.69615. The RSI is trading slightly above 50, showing the bulls still have some control. However, we can see that bulls have steadily become weaker. As the price made new higher highs, the RSI made lower highs. This is a sign of weaker momentum.
–Are you interested to learn about forex robots? Check our detailed guide-
At this point, the price might bounce off the 30-SMA and push higher, showing bulls were just resting, or it might break below the 30-SMA. A break below the SMA would confirm the divergence.
Looking to trade forex now? Invest at eToro!
67% of retail investor accounts lose money when trading CFDs with this provider. You should consider whether you can afford to take the high risk of losing your money.
