- RBA raised rates by 50bps.
- RBA might slow its monetary policy.
- Markets are awaiting the significant US inflation data.
The AUD/USD weekly forecast is slightly bearish ahead of US inflation as markets brace for an aggressive Fed rate hike.
-If you are interested in knowing about ETF brokers, then read our guidelines to get started-
Ups and downs of AUD/USD
The pair started the week slow on Monday, as no significant news releases existed. On Tuesday, Australia’s central bank increased the cash rate by 50 basis points to a seven-year high of 2.35% and left the door open for future tightening as it battles to contain soaring inflation.
Australia’s current account surplus increased significantly in the June quarter as resource exports saw a significant increase in both quantities and prices, which significantly supported economic growth.
After five rate rises in as many months, Australia’s top central banker Philip Lowe hinted on Thursday that the bank’s policy tightening would halt. This contributed to a bond rally as markets reduced their bets on more aggressive actions.
According to Fed Chair Jerome Powell, there is still a chance the FED can battle inflation without the “quite significant social costs” associated with previous efforts to rein in rising prices.
Next week’s key events for AUD/USD
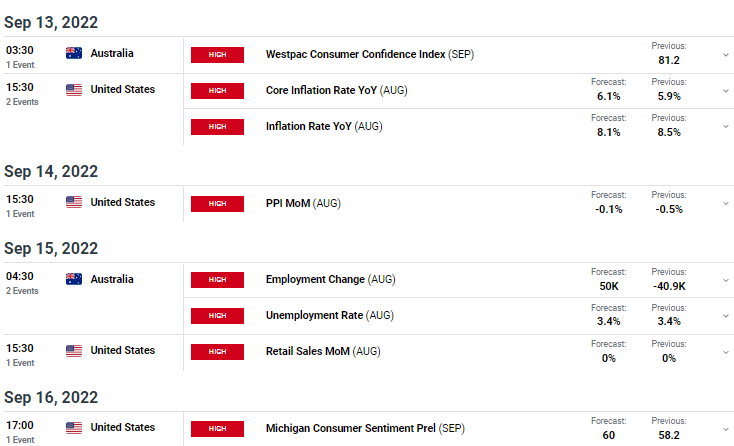
Australia’s unemployment rate fell to a 48-year low in July despite employment experiencing its first annual decline after a super-strong run, a mixed figure indicating some cooling in the scorching labor market. Investors expect employment to grow in August and unemployment to hold at 3.4%.
In the US, investors are awaiting the inflation data that will affect bets on this month’s rate hike from the Federal Reserve.
AUD/USD weekly technical forecast: The possible end of lower lows and a downtrend
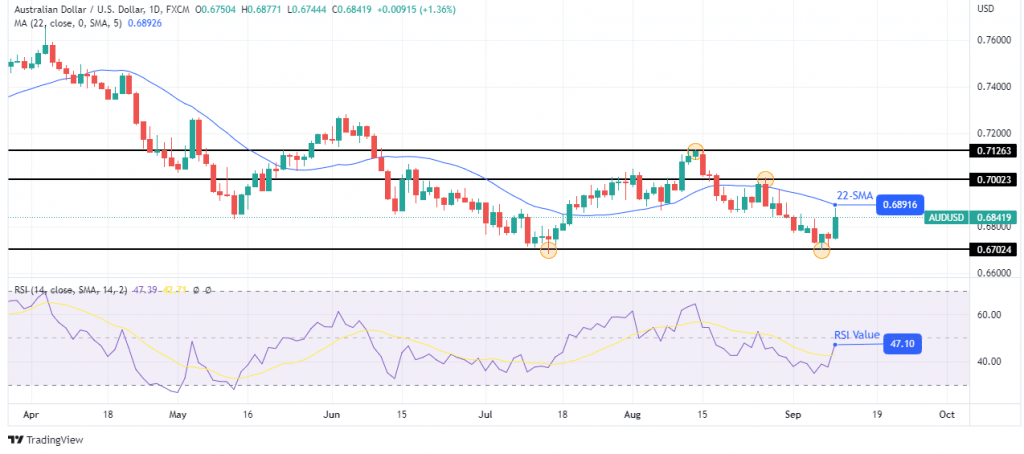
The daily chart shows the price trading slightly below the 22-SMA and RSI slightly below 50. The price is coming up to the SMA resistance, which might bounce lower or break above. The price was unable to break below the 0.67024 support level. It was also unable to reach a lower low than that posted on July 14. Buyers came in strong at the support level, pushing the price higher.
-Are you looking for high leveraged forex brokers? Take a look at our detailed guideline to get started-
At this point, if the 22-SMA holds as resistance, the price might retest the 0.67024 support and possibly break lower. This would mean a continuation of the downtrend. However, if the price breaks above the SMA, we might see it retesting resistance at 0.70023 and higher at 0.71263.
Looking to trade forex now? Invest at eToro!
68% of retail investor accounts lose money when trading CFDs with this provider. You should consider whether you can afford to take the high risk of losing your money.
