AUD/USD rebounded last week with strong gains, as the pair climbed 140 points and closed the week at the symbolic 0.70 level. There are six indicators this week. Here is an outlook on the major market-movers and an updated technical analysis for AUD/USD.
The Aussie put together a winning week for the first time since December, taking advantage of weak US jobless claims. Australian consumer confidence numbers were down sharply and Chinese GDP edged lower, but AUD/USD still posted strong gains.
- NAB Business Confidence: Monday, 00:30. Business Confidence jumped to 5 points in November, pointing to improving conditions. Will the upswing continue in December?
- MI Leading Index: Tuesday, 23:30. This index is based on 9 economic indicators, but has limited impact since most of the data was previously released. The indicator posted a decline of 0.2%, marking a 3-month low.
- Australia CPI: Wednesday, 00:30. This key indicator is released each quarter, and an unexpected reading can have a strong impact on the direction of AUD/USD. The index dipped to 0.5% in Q3, short of the forecast of 0.7%. The markets are braced for a weaker release in Q4, with an estimate of 0.3%.
- Trimmed Mean CPI: Wednesday, 00:30. This indicator excludes the most volatile items which are found in CPI. The index slipped to 0.3% in Q3, short of the estimate of 0.6%. This marked the index’s worst showing in ten quarters. The markets are predicting better news in Q4, with an estimate of 0.5%.
- Import Prices: Thursday, 00:30. This quarterly indicator posted two strong gains of 1.4% in the past two releases. However, the markets are bracing for a downturn in Q4, with an estimate of -0.8%.
- PPI: Friday, 00:30. PPI measures inflation in the manufacturing sector. The index posted a strong gain of 0.9% in Q3, well above the estimate of 0.3%. The forecast for Q4 is 0.6%.
* All times are GMT.
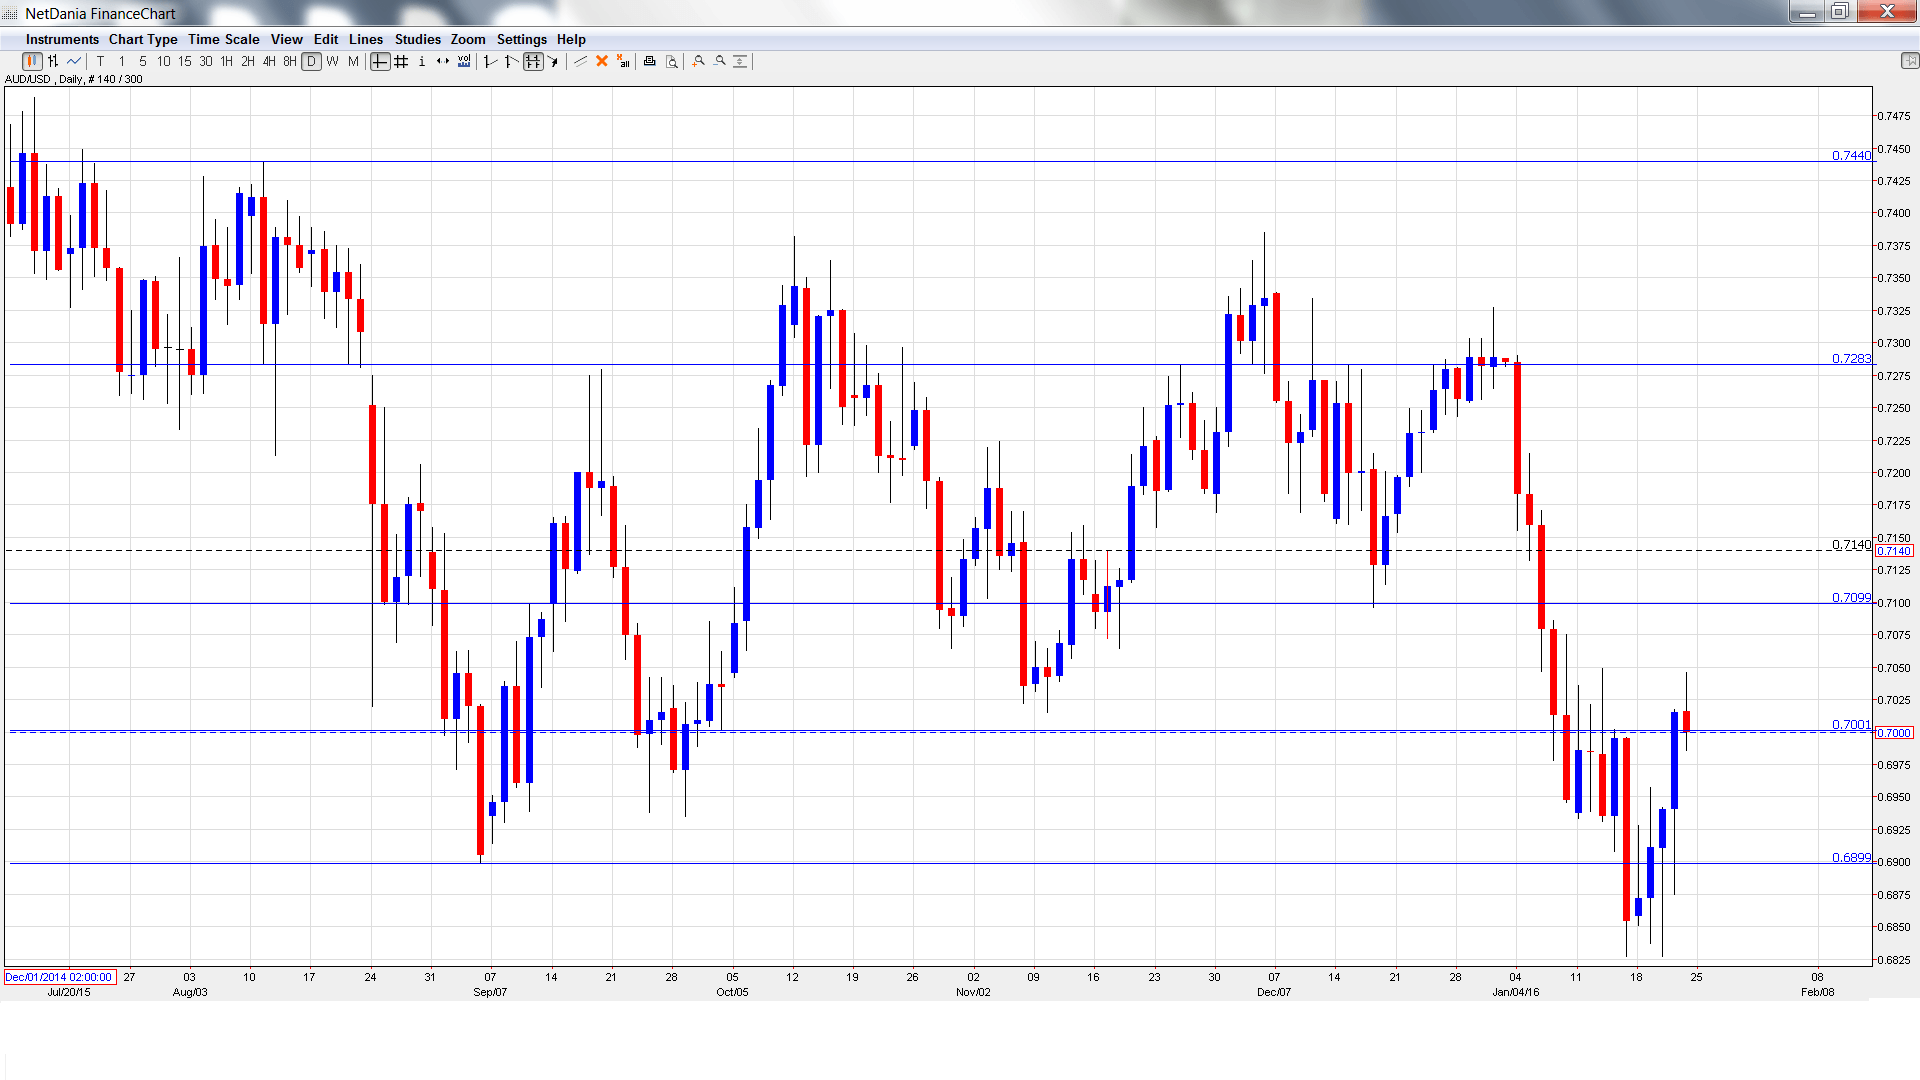
AUD/USD Technical Analysis
AUD/USD opened the week at 0.6858 and quickly touched a low of 0.6827. It was all uphill from there, as ,the pair pushed all the way to 0.7046, testing the 0.70 level (discussed last week). The pair closed the week at 0.7000.
Live chart of AUD/USD: [do action=”tradingviews” pair=”AUDUSD” interval=”60″/]
Technical lines from top to bottom:
We start with resistance at 0.7440. This line capped the pair in August.
0.7284 is next.
0.7100 has held firm in resistance since early January.
The round number of 0.70 worked as a cushion in August. It was tested last week and the pair ended the week on this symbolic line.
0.6899 has provided support since September. It is a weak line.
0.6775 is the next support level.
0.6686 was an important cap back in January 2000.
0.6532 is the final support level for now.
I am neutral on AUD/USD
The recent rush away from risk towards the safe-haven US dollar has abated for now. Will the Aussie continue last week’s rally? Weak US inflation and employment numbers may have put a March rate hike on hold, but the US economy remains solid, and sentiment towards the US dollar is strong.
In our latest podcast we update from the currency war front
Follow us on Sticher or on iTunes
Further reading:
- For a broad view of all the week’s major events worldwide, read the USD outlook.
- For EUR/USD, check out the Euro to Dollar forecast.
- For the Japanese yen, read the USD/JPY forecast.
- For GBP/USD (cable), look into the British Pound forecast.
- For the Canadian dollar (loonie), check out the Canadian dollar forecast.
- For the kiwi, see the NZD/USD forecast.
