AUD/USD continues to struggle, as the pair posted losses for a fifth straight week. AUD/USD lost about 90 points and closed the week at 0.7277. This week’s highlights are Building Approvals and PPI. Here is an outlook on the major market-movers and an updated technical analysis for AUD/USD.
US numbers showed improvement this week, as New Home Sales jumped and unemployment claims dropped sharply. In Australia, some strong numbers were not enough to prevent the Aussie slide from continuing. CPI jumped 0.7% in Q1, its highest gain since Q4 of 2013. As well, NAB Quarterly Business Confidence was up sharply.
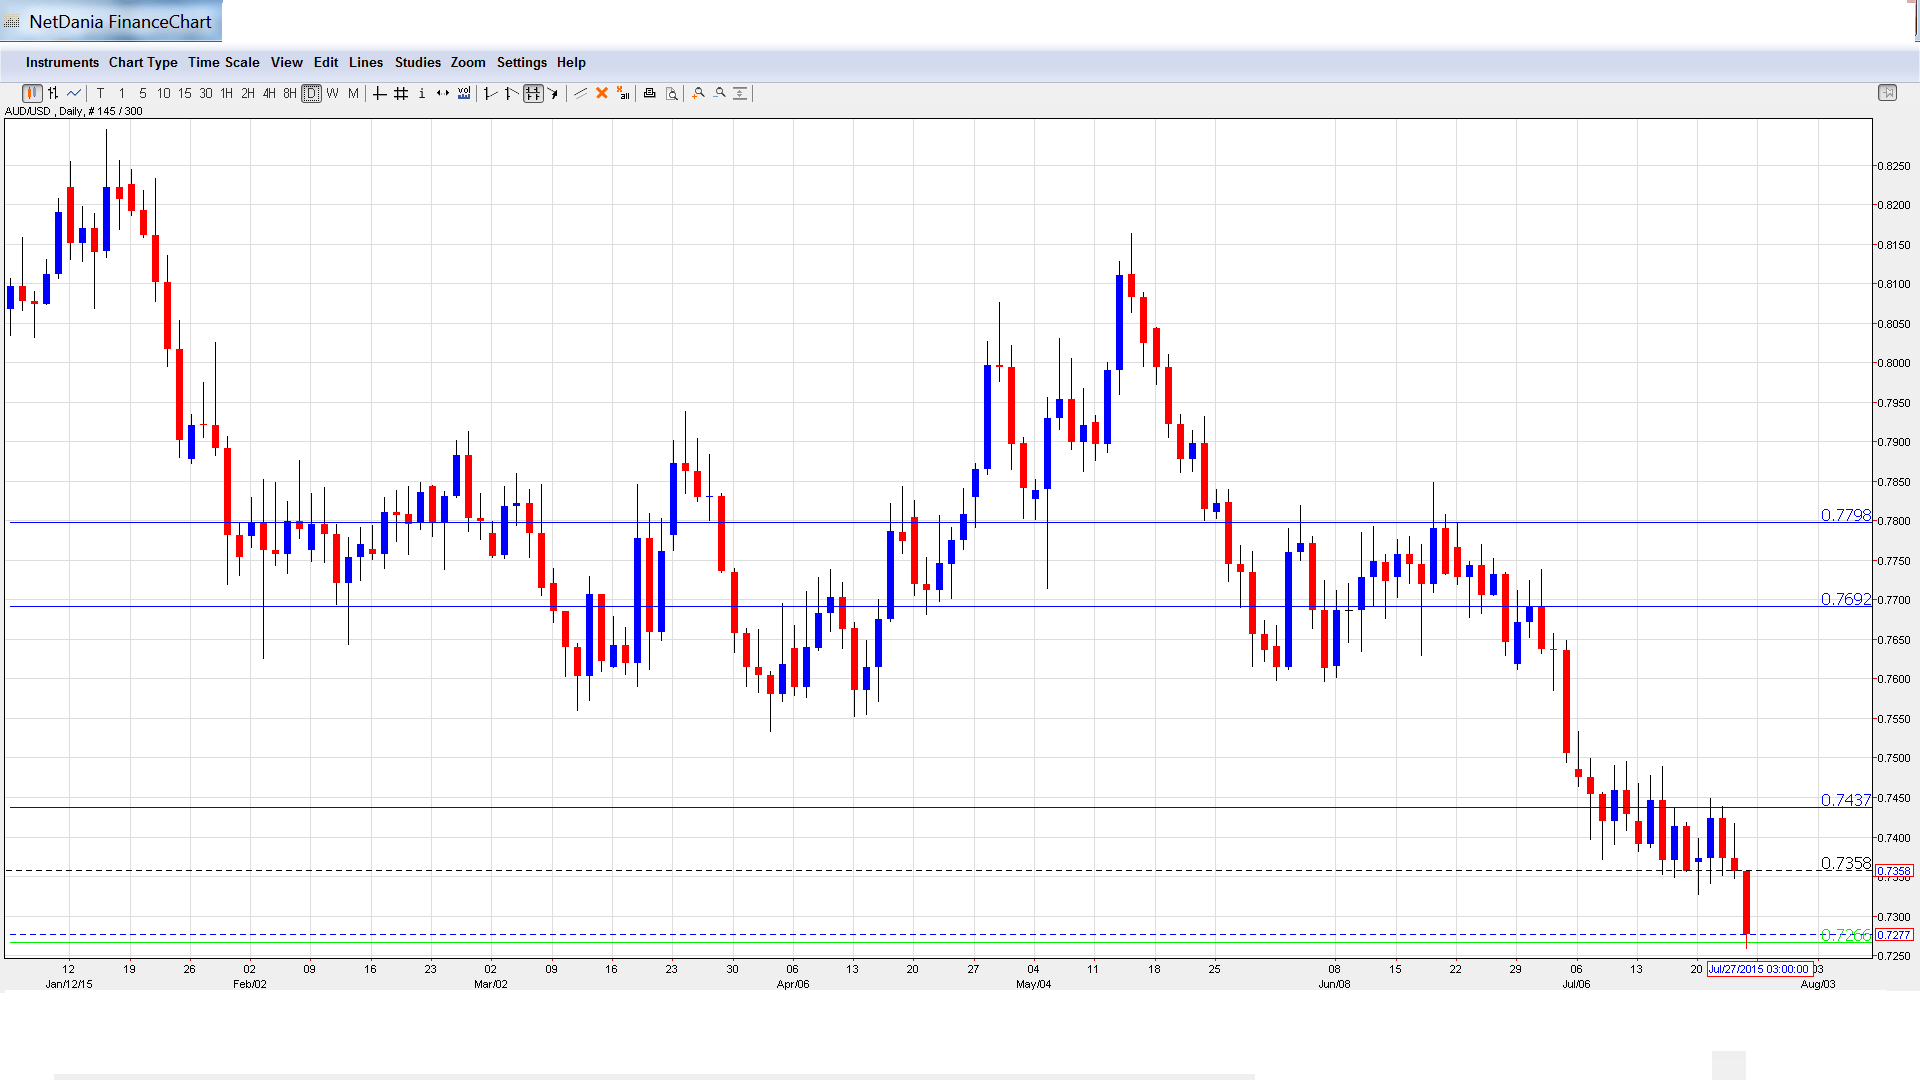
[do action=”autoupdate” tag=”AUDUSDUpdate”/]AUD/USD graph with support and resistance lines on it. Click to enlarge:
- RBA Governor Stevens Speaks: Thursday, 00:30. Stevens will speak at a financial forum in Sydney. Analysts will be listening closely, looking for any clues as to the RBA’s plans regarding interest rate policy.
- Building Approvals: Thursday, 1:30. This indicator is a key release which should be treated as a market-mover. The indicator tends to show strong fluctuation, which often leads to readings which are well off the estimates. The May reading showed a strong gain of 2.4%, crushing the forecast of 1.2%. The markets are bracing for a decline in the June report, with an estimate of -0.9%.
- Import Prices: Thursday, 1:30. Import Prices are released on a quarterly basis, magnifying the impact of each reading. The Q1 release surprised with a 0.2% decline, as the markets had expected a strong gain of 1.1%. The Q2 report is expected to bring better news, with an estimate of a 1.4% gain.
- PPI: Friday, 1:30. PPI is the primary gauge of consumer inflation, and an unexpected reading can have a major impact on the movement of AUD/USD. The index looked solid in Q1, posting a gain of 0.5%, which was above expectations. Will the indicator post another gain in the Q2 report?
- Chinese Manufacturing PMI: Saturday, 1:00. The Aussie is sensitive to key Chinese data such as PMIs, as the Asian giant is Australia’s number one trading partner. The index has hovered just above the 50-point line (which separates contraction from expansion) for most of the year, and was unchanged in the June release at 50.2 points. An identical reading is expected in July report.
* All times are GMT.
AUD/USD Technical Analysis
AUD/USD opened the week at 0.7368 and climbed to a high of 0.7449. The pair then reversed directions, touching a low of 0.7267, as support held firm at 0.7266 (discussed last week). AUD/USD closed the week at 0.7277.
Live chart of AUD/USD: [do action=”tradingviews” pair=”AUDUSD” interval=”60″/]
Technical lines from top to bottom:
We begin with resistance at 0.7798. This line was an important resistance level for much of June.
0.7692 remains a strong resistance line.
0.7597 was an important support level in June.
0.7438 marked the start of the current greenback rally, which has seen the pair dip below the 0.73 line.
0.7266 was tested in support and is an immediate line.
0.7113 has held firm since April 2009.
0.7011 was a key support level in March 2006. It is protecting the symbolic line of 0.70.
0.6931 is the next support line.
0.6843 is the final support level for now.
I am bullish on USD/AUD
In the US, stronger housing and job numbers have increased speculation about a rate hike by the Fed, perhaps as early as September. All eyes will be on the Fed policy statement later this week, as any hints about a rate hike could help the US dollar rally even higher.
In our latest podcast, we drill down the deals, the aGreekment and Iran and the market impact.
Further reading:
- For a broad view of all the week’s major events worldwide, read the USD outlook.
- For EUR/USD, check out the Euro to Dollar forecast.
- For the Japanese yen, read the USD/JPY forecast.
- For GBP/USD (cable), look into the British Pound forecast.
- For the Canadian dollar (loonie), check out the Canadian dollar forecast.
- For the kiwi, see the NZDUSD forecast.
