AUD/USD posted sharp gains last week, soaring 250 points. The pair closed at 0.7689, its highest weekly gain since April 2016. This week’s key event is the RBA Monetary Policy Minutes. Here is an outlook on the major market-movers and an updated technical analysis for AUD/USD.
There were no surprises as the Fed pressed the rate trigger and raised rates to the 0.75%-1.00% range. This led to broad losses by the US dollar (here are 5 reasons why the dollar dropped). Consumer inflation and retail sales were soft but within expectations. In Australia, job numbers disappointed, as the economy unexpectedly shed jobs and the unemployment rate moved higher.
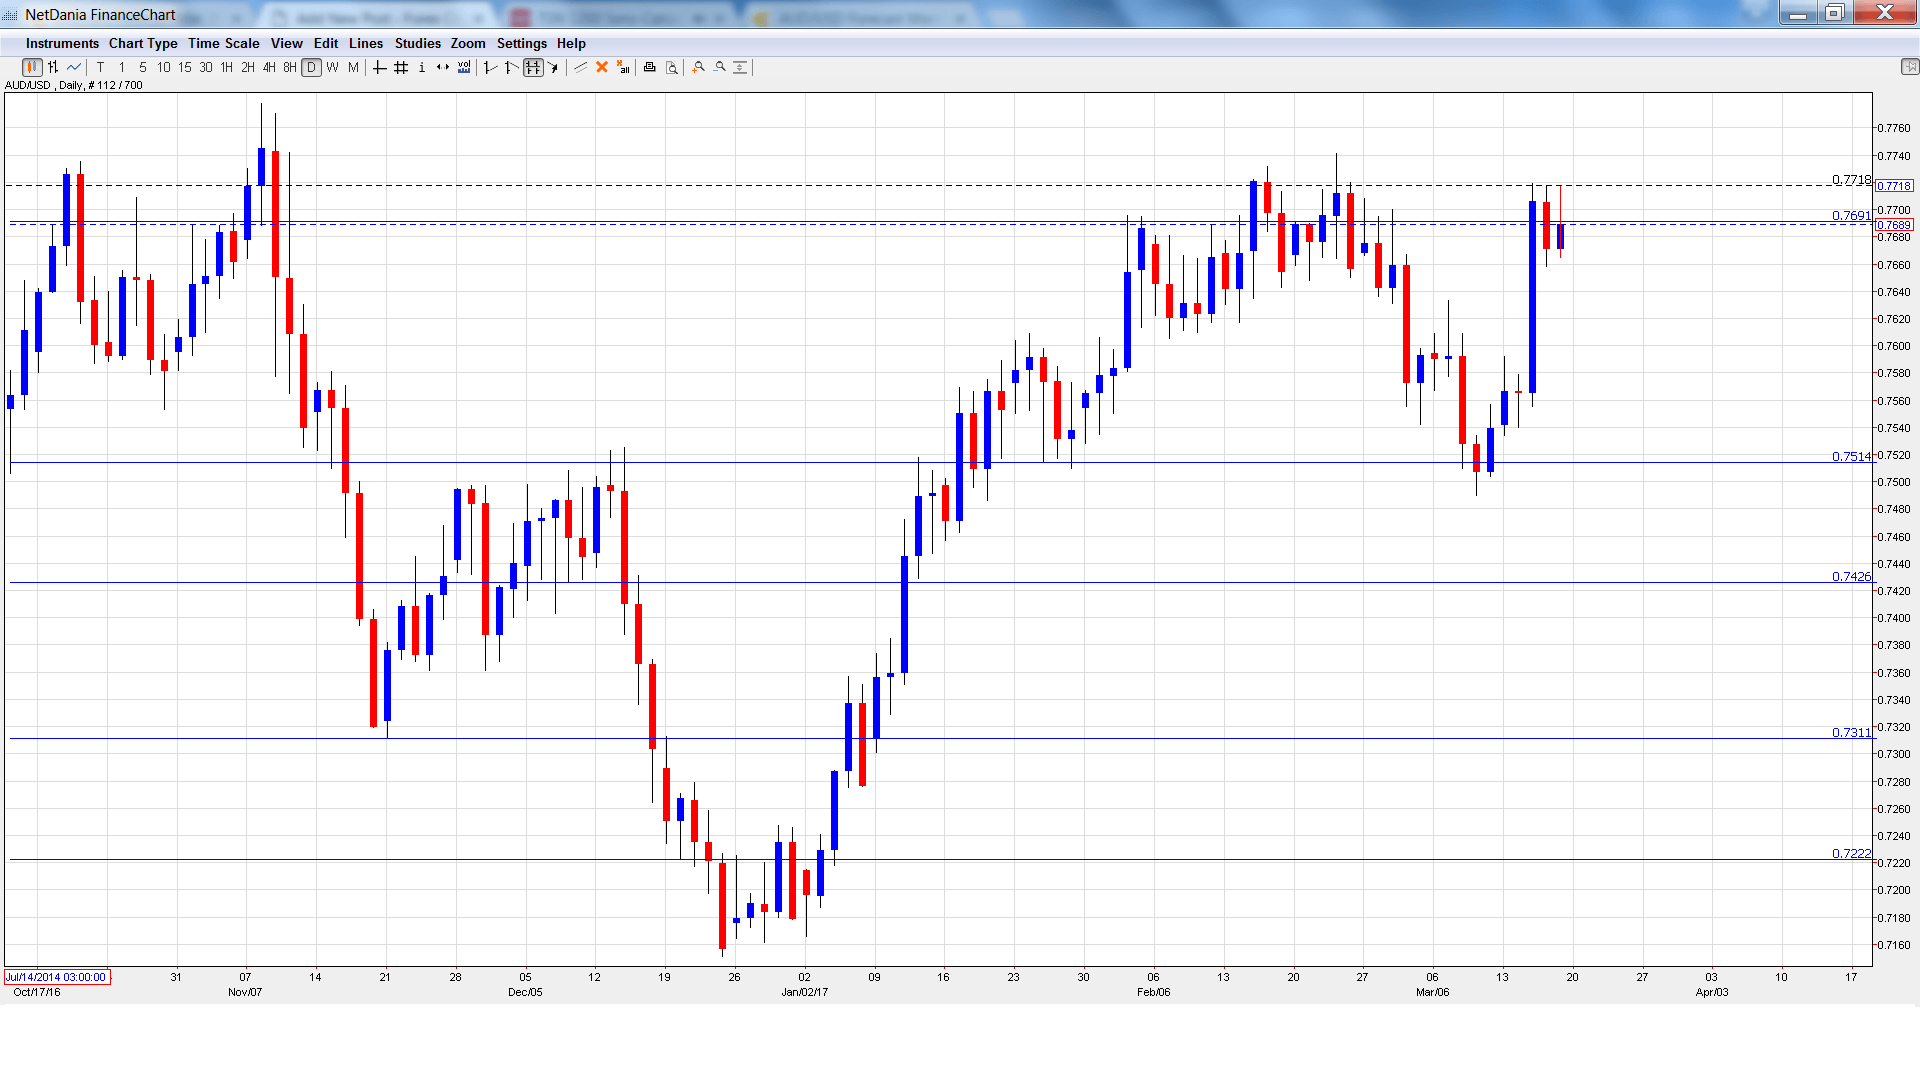
[do action=”autoupdate” tag=”AUDUSDUpdate”/]AUD/USD daily graph with support and resistance lines on it. Click to enlarge:
- CB Leading Index: Monday, 14:30. This minor event is based on 7 economic indicators. In December, the index changed directions and declined 0.1%. Will we see a rebound in the January report?
- RBA Monetary Policy Meeting Minutes: Tuesday, 00:30. The minutes will provide details of the RBA’s March policy meeting, at which the central bank held rates at 1.50%. A hawkish tone to the minutes could push the Aussie upwards.
- HPI: Tuesday, 00:30. This index provides a snapshot of the level of activity in the housing sector. The indicator slipped to 1.5% in Q3, well short of the forecast of 2.6%. The estimate for Q4 stands at 2.4%.
- MI Leading Index: Tuesday, 23:30. The index has been generally muted in recent months, with flat readings of 0.0% in two of the past three readings. Will we see a gain in the February report?
- RBA Assistant Governor Guy Debelle Speech: Wednesday, 1:40. Debelle will deliver remarks at a conference in Singapore. The markets will be looking for clues as to the RBA’s future monetary policy plans.
AUD/USD Technical Analysis
AUD/USD opened the week at 0.7541 and quickly climbed to a high of 0.7534. The pair then reversed directions and jumped to a high of 0.7719, testing resistance at 0.7691 (discussed last week). AUD/USD closed the week at 0.7689.
Live chart of AUD/USD:
Technical lines from top to bottom:
We start with resistance at 0.8066.
0.7938 is next. This line has held in resistance since May 2015.
0.7835 was the high point in April 2016.
0.7691 is under pressure in resistance. It is a weak line and could see action further in the week.
0.7513 is providing support. It was a cushion in April 2015.
0.7427 is next.
0.7311 marked a low point in November.
0.7223 is the final support level for now.
I am bearish on AUD/USD
The Fed raised rates last week and will likely do so again in the summer, which is bullish for the greenback. Also, the US economy is performing well and employment and consumer confidence numbers remain strong.
Our latest podcast is titled The Art of the Dovish Hike
Follow us on Sticher or iTunes
“‹
Safe trading!
Further reading:
- For a broad view of all the week’s major events worldwide, read the USD outlook.
- For EUR/USD, check out the Euro to Dollar forecast.
- For the Japanese yen, read the USD/JPY forecast.
- For GBP/USD (cable), look into the British Pound forecast.
- For the Canadian dollar (loonie), check out the Canadian dollar forecast.
- For the kiwi, see the NZD/USD forecast.
