AUD/USD retracted last week, losing about 65 points. The pair closed at 0.7250. There are seven events on the schedule this week. Here is an outlook on the major market-movers and an updated technical analysis for AUD/USD.
Australian job numbers sagged last week, briefly pushing AUD/USD to lower levels. The news wasn’t very good out of the US either, as poor retail sales and weak manufacturing data weighed on the greenback.
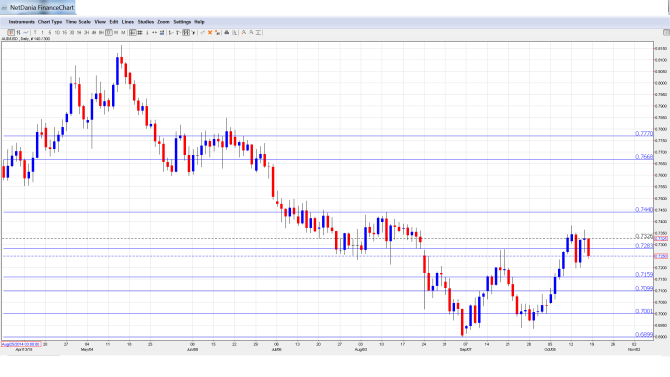
[do action=”autoupdate” tag=”AUDUSDUpdate”/]AUD/USD graph with support and resistance lines on it. Click to enlarge:
- Chinese GDP: Monday, 2:00. The Australian dollar is sensitive to major Chinese releases such as GDP, as the Asian giant is Australia’s number one trading partner. Chinese GDP grew by 7.0% in the past two quarters, and is expected to soften to 6.8% in Q3. A weaker than expected reading could push the Aussie lower.
- Chinese Industrial Production: 2:00. The indicator showed little movement in September, posting a gain of 6.1%, which was within expectations. The October estimate stands at 6.0%.
- RBA Monetary Policy Meeting Minutes: Tuesday, 00:30. This event should be treated as a market-mover. The RBA held interest rates at 2.0% earlier this week, and analysts will be looking for hints of a future rate cut or the RBA’s view of the performance of the domestic economy.
- CB Leading Index: Tuesday, 23:00. This minor index is based on 7 economic indicators. The index bounced back in July with a gain of 0.3%, after a decline of 0.2% a month earlier.
- MI Leading Index: Tuesday, 23:30. This index is also struggling, and came in at -0.3% in August. This marked the indicator’s worst showing since March.
- RBA Assistant Governor Malcolm Edey Speaks: Wednesday, 22:45. Edey will speak at a financial conference in Sydney. A speech which is more hawkish than expected is bullish for the Australian dollar.
- NAB Quarterly Business Confidence: Thursday, 00:30. Confidence in the business sector can lead to increased hiring and spending, so analysts always pay close attention to this event. The indicator improved to 4 points in Q2, up from 0 points in Q1. Will the upswing continue in Q3?
* All times are GMT.
AUD/USD Technical Analysis
AUD/USD started the week at 0.7313 and climbed to a high of 0.7382. The pair then reversed directions and dropped to a low of 0.7197, testing support at 0.7213 (discussed last week). The pair closed at 0.7250.
Live chart of AUD/USD: [do action=”tradingviews” pair=”AUDUSD” interval=”60″/]
Technical lines from top to bottom:
0.7770 was an important cap in June.
0.7664 is next.
0.7440 capped the pair back in August, and remains key resistance.
0.7284 is a clear separator of ranges, also seen around the same time, and is also stronger.
The support line of 0.7213 was tested last week and is providing weak support.
0.7160 capped the pair quite recently and could slow a rise.
0.71 is the next support line.
The very round level of 0.70 worked as a cushion in August and is under strong pressure.
The round level of 0.69 is the final support line for now.
I am bearish on AUD/USD
The RBA didn’t make further cuts, but the resource-reliant economy continues to struggle with weak global demand. The Fed may not make a move until 2016, but monetary divergence will continue to weigh on the Aussie.
In our latest podcast we analyze Varoufakis’ 4 problems and 4 solutions, and more
Follow us on Sticher or on iTunes
Further reading:
- For a broad view of all the week’s major events worldwide, read the USD outlook.
- For EUR/USD, check out the Euro to Dollar forecast.
- For the Japanese yen, read the USD/JPY forecast.
- For GBP/USD (cable), look into the British Pound forecast.
- For the Canadian dollar (loonie), check out the Canadian dollar forecast.
- For the kiwi, see the NZD/USD forecast.
