The Australian dollar continues to sag, as AUD/USD lost close to 200 points last week. The upcoming week promises to busy, with three major events on the calendar – Retail Sales, Building Approvals and Trade Balance. Here is an outlook on the major market-movers and an updated technical analysis for AUD/USD.
The US economy continued to post strong numbers, as New Home Sales beat the estimate and GDP sparkled with a 4.6% gain in Q2. Down under, RBA Governor Glenn Stevens said that the RBA was concerned about a housing market correction, and would consider tightening credit regulations to ease the rise in home prices. He certainly contributed to the downfall. Will the pair reach the cycle lows?
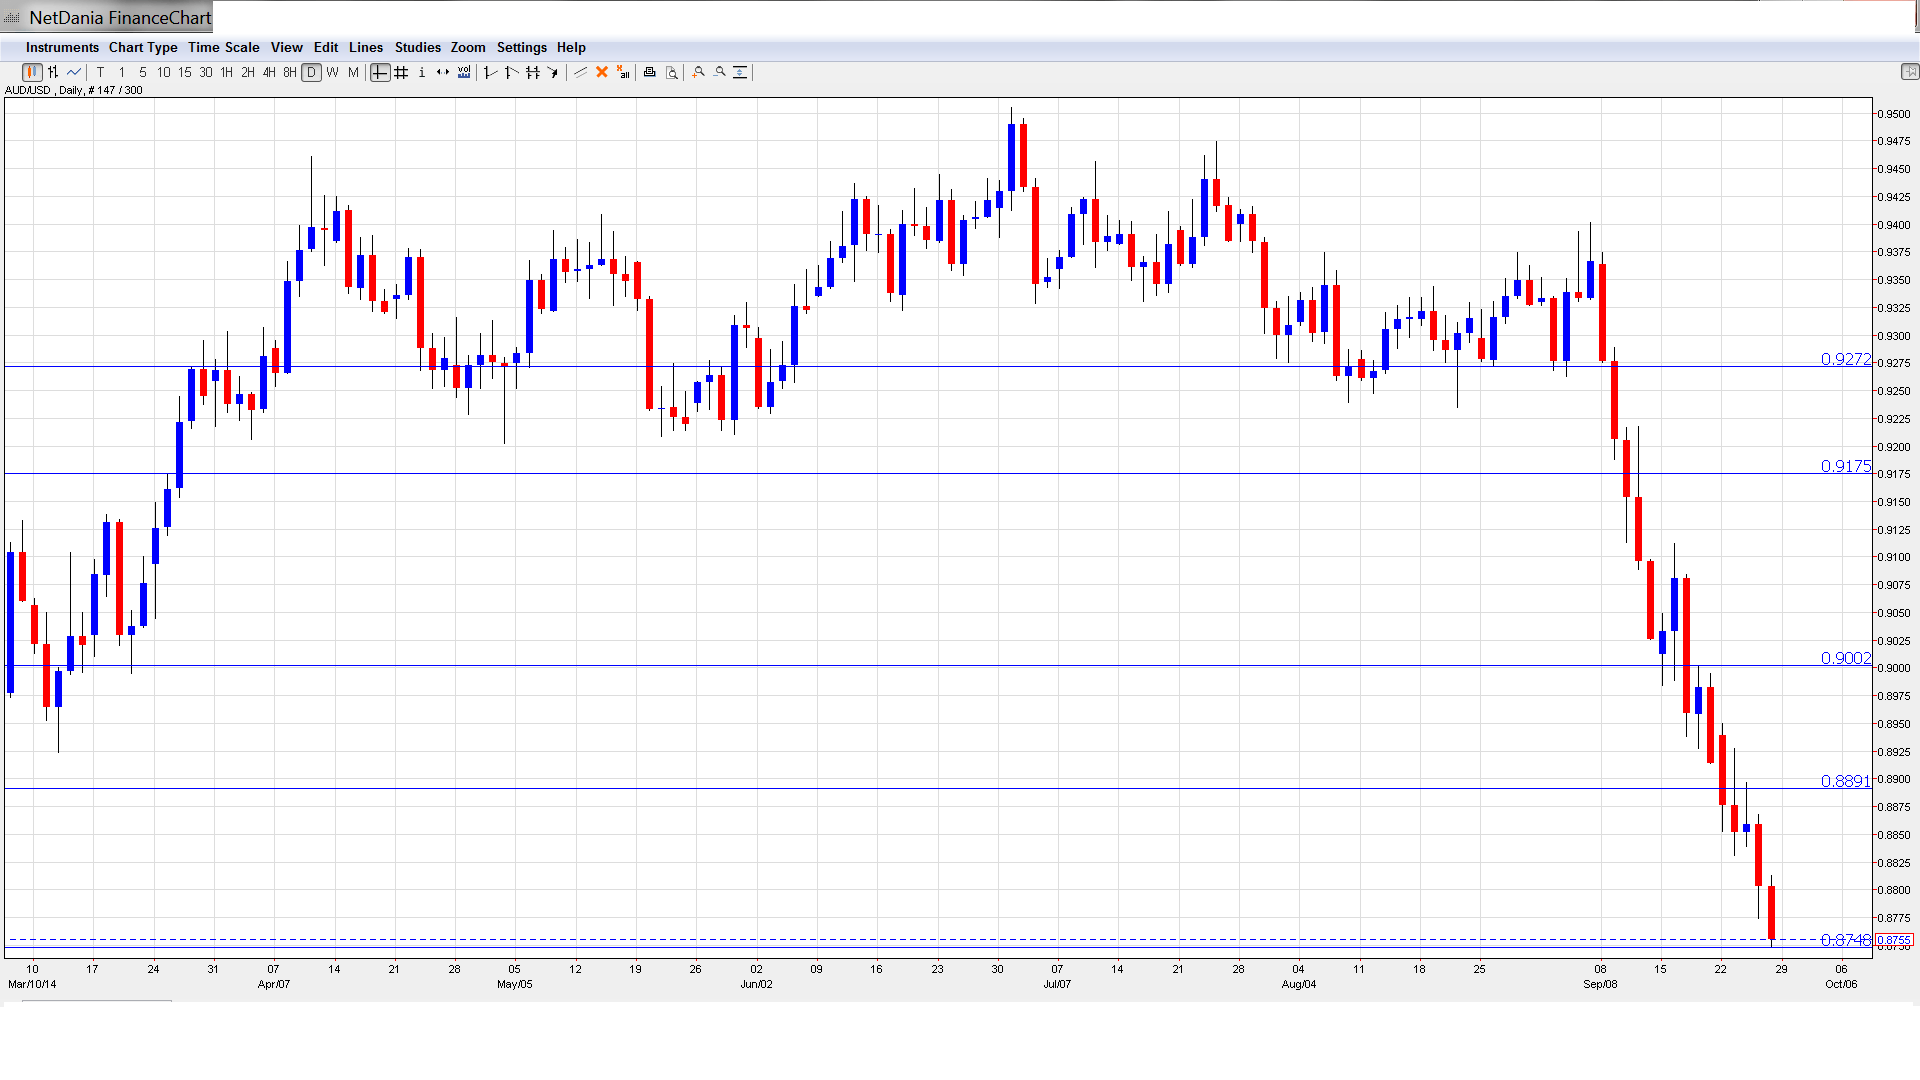
[do action=”autoupdate” tag=”AUDUSDUpdate”/]AUD/USD graph with support and resistance lines on it. Click to enlarge:
- Private Sector Credit: Tuesday, 1:30. The change in the amount of credit issued to consumers and businesses is closely related to spending by the private sector, which is an important component of economic growth. The indicator slipped to 0.4% last month, just shy of the estimate of 0.5%. The estimate for the upcoming release stands at 0.5%.
- Chinese HSBC Final Manufacturing PMI: Tuesday, 1:45. The Australian dollar is sensitive to key Chinese data, as China is Australia’s most important trading partner. The index has been in a growth mode, with three straight readings above the 50-point level. The estimate for the August reading stands at 50.5 points.
- AIG Manufacturing Index: Tuesday, 23:30. This PMI-like figure has only been in growth territory once this year. In July, the indicator slipped to 47.3 points, a 4-month low.
- Chinese Manufacturing PMI: Tuesday, 1:45. This is the second Manufacturing PMI of the week. The index has been just above the 50-point line for close to two years, pointing to slight growth in the manufacturing sector.
- Retail Sales: Wednesday, 1:30. Retail Sales is the primary gauge of consumer spending. The indicator posted a gain of 0.4% last month, matching the forecast. An identical reading is expected in the August release.
- Commodity Prices: Wednesday, 6:30. Year over year, commodity prices have been falling since early 2012. The indicator posted another sharp decline last month, coming in at -11.5%. The Australian economy leans heavily on commodity exports, especially metals.
- HIA New Home Sales: Thursday, Tentative. The indicator looked awful last month, posting a drop of 5.7%. This was the sharpest decline we’ve since July 2012. The markets will be hoping for some improvement in the August release.
- Building Approvals: Thursday, 1:30. This key indicator tends to be volatile, so market estimates are often way off the mark, leading to some movement from AUD/USD. The indicator came in at 2.5% last month, and the estimate for the upcoming release stands at 1.1%.
- Trade Balance: Thursday, 1:30. While Australia has recurring deficits in the current account, the trade balance shifts between surpluses and deficits. In August, Australia recorded a deficit of 1.36 billion A$, better than the estimate of a deficit of 1.77 billion A$. The markets are expecting a smaller deficit of 0.78 billion A$ in August.
- RBA Annual Report: Thursday, 5:15. The RBA’s annual report provides a summary of the central bank’s operations and financial statements. It is a minor event, unlikely to affect the direction of AUD/USD.
- AIG Services Index: Thursday, 23:30. The index continues to point to contraction in the services sector, with only one reading above 50 since January 2012. The past reading came in at 49.4 points, so the key 50-point level is within striking distance.
* All times are GMT.
AUD/USD Technical Analysis
AUD/USD started the week at 0.8939 and quickly touched the week’s high of 0.8950. It was all downhill from there, as the pair tumbled to 0.8748, breaking below support at 0.8763 (discussed last week). AUD/USD closed the week at 0.8755.
Live chart of AUD/USD: [do action=”tradingviews” pair=”AUDUSD” interval=”60″/]
Technical lines from top to bottom:
With the Aussie falling sharply last week, we start at lower levels:
There is resistance at 0.9270. This line supported the pair in August but reverted to resistance in September with the Australian dollar sustaining steep losses.
0.9175 remains a strong resistance line.
The round number of 0.9000 has some breathing room as the pair dropped sharply last week.
0.8891 was easily breached and has switched to a resistance role.
0.8750 is an immediate support line. This line was breached on Friday but recovered. It could see further action early in the week.
0.8660 is a key support level. This line has remained intact since January.
0.8550 has held firm since December 2007.
0.8316 is the final support level for now. This line marked the start low point of a US dollar rally which saw the greenback climb above the 1.10 level.
I am bearish on AUD/USD.
The shaky Aussie finds itself at its lowest levels since February, and could lose more ground to the greenback. US numbers have looked solid, and the markets are expecting a strong NFP late in the week. With the Fed set to wean the economy off QE in October, there will be more focus on the timing of an interest rate hike.
More: Are the AUD and NZD currencies on path for more devaluation?
In our latest episode, we talk about Contango vs. Backwardation, Scottish reverberations and key US data:
Subscribe to our podcast on iTunes.
- For a broad view of all the week’s major events worldwide, read the USD outlook.
- For EUR/USD, check out the Euro to Dollar forecast.
- For the Japanese yen, read the USD/JPY forecast.
- For GBP/USD (cable), look into the British Pound forecast.
- For the Australian dollar (Aussie), check out the AUD to USD forecast.
- USD/CAD (loonie), check out the Canadian dollar.
