AUD/USD continued its losing ways last week, losing close to 100 points, as the pair closed at 0.8922. AUD/USD has now slipped to its lowest level since March. It’s another quiet week on the release front, highlighted by a speech by RBA Governor Glenn Stevens in Melbourne. Here is an outlook on the major market-movers and an updated technical analysis for AUD/USD.
The Aussie got a temporary boost from reports about Chinese stimulus. However, the Aussie proved its weakness by being unable to hold on to gains, and eventually lost and fell further away from the 0.90 level. US job claims dropped sharply last week, and the Fed hinted that once rates are raised, subsequent hikes could take place more quickly than expected. This certainly helped the greenback.
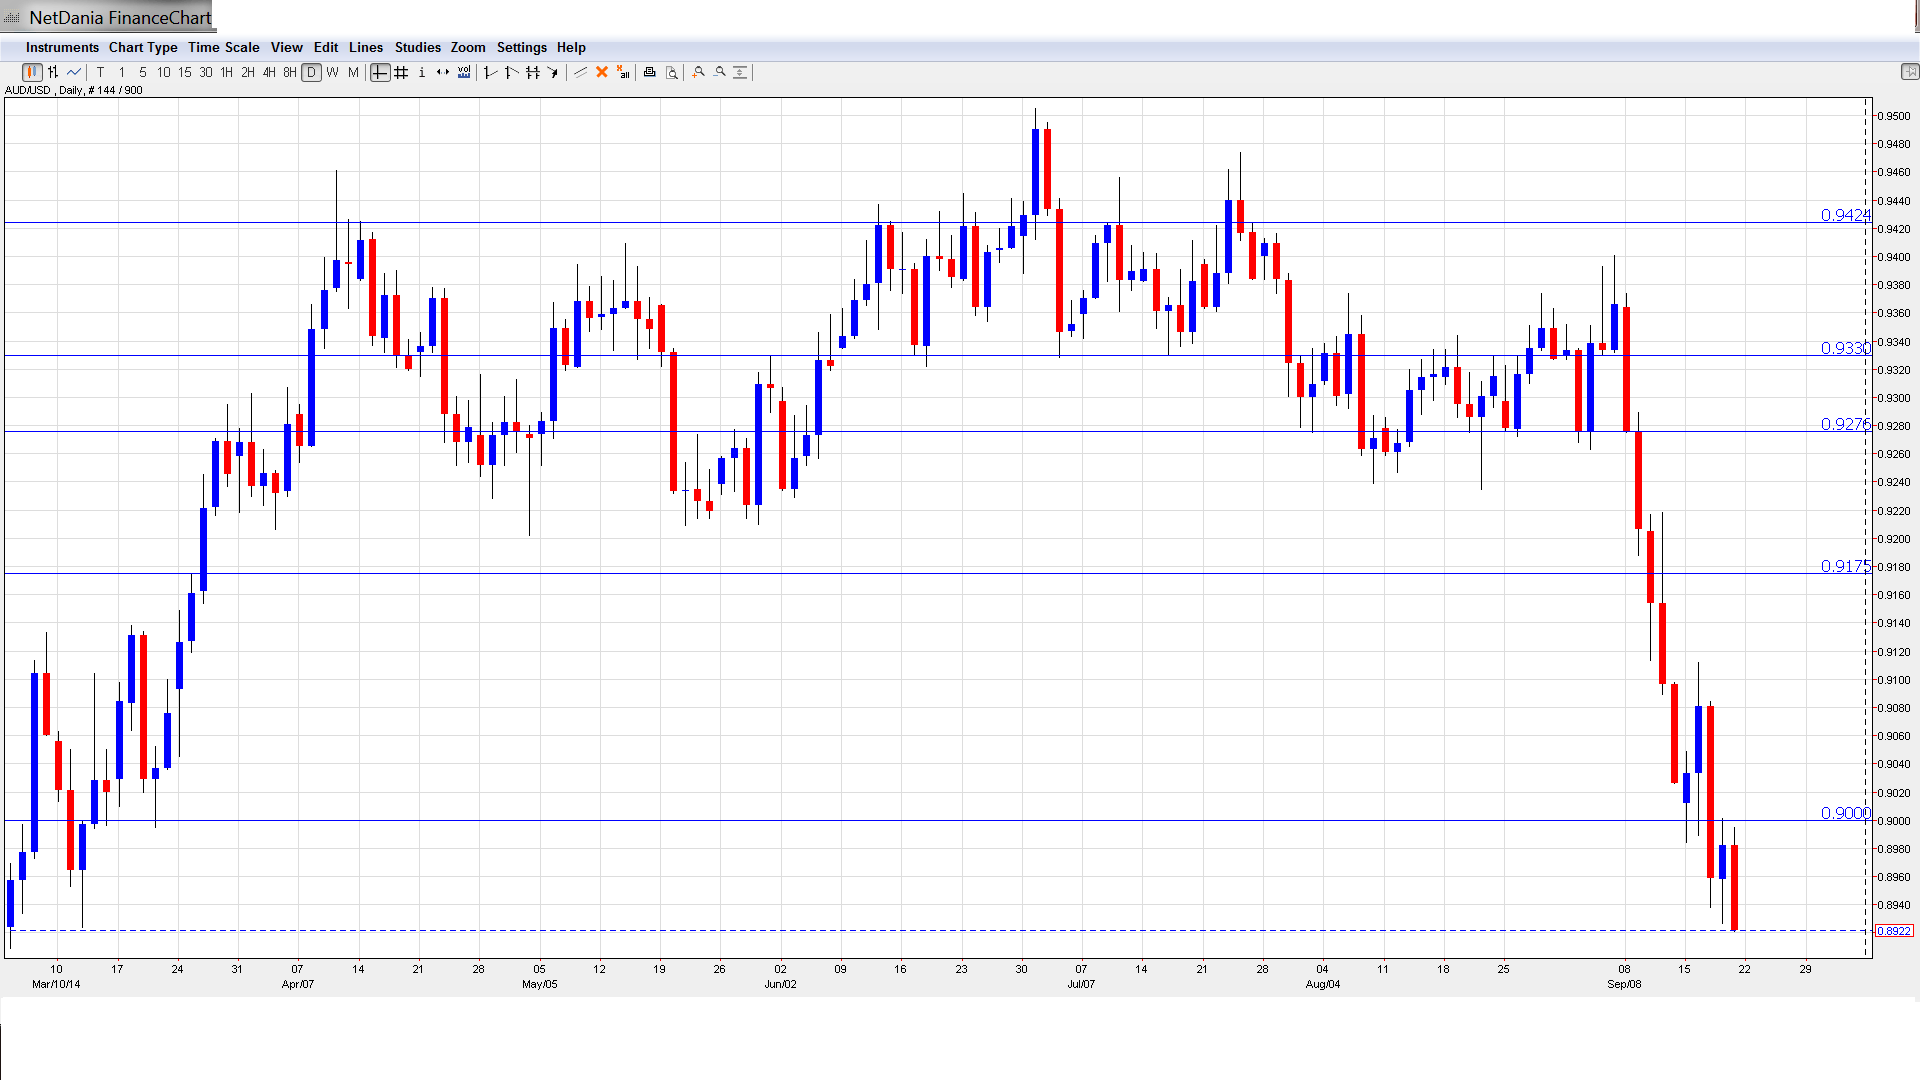
[do action=”autoupdate” tag=”AUDUSDUpdate”/]AUD/USD graph with support and resistance lines on it. Click to enlarge:
- CB Leading Index: Wednesday, 00:00. This composite index is based on 7 economic indicators, and helps analysts track in what direction the economy is headed. The index improved to 0.4% in the previous release, its best reading since January. Will the upswing continue in the August release?
- RBA Financial Stability Review: Tuesday, 00:00. This semi-annual report looks at conditions and risks in the financial system, and analysts will be combing through, looking for hints as to future monetary policy.
- RBA Governor Glenn Stevens Speaks: Thursday, 2:30. This is the key event of the week. Stevens will address the Melbourne Economic Forum and any unexpected comments could lead to some volatility from AUD/USD. Stevens tried to talk down the A$ several times. He usually had more success when it was already leaning lower. Will he do this again?
* All times are GMT.
AUD/USD Technical Analysis
AUD/USD started the week at 0.9012 and quickly moved to a high of 0.9112. The pair then made a sharp U-turn, dropping all the way to 0.8921, as support held firm at 0.8891 (discussed last week). AUD/USD closed the week at 0.8922.
Live chart of AUD/USD: [do action=”tradingviews” pair=”AUDUSD” interval=”60″/]
Technical lines from top to bottom:
We start with resistance at 0.9425, which served as resistance in April and occasionally capped the pair afterwards.
0.9330 was a cushion for the pair during July but has reverted to a resistance role after the Aussie’s sharp drop last week.
0.9270 supported the pair in August but reverted to resistance in September as the Aussie has sustained steep losses.
0.9175 remains a strong resistance line.
The round number of 0.9000 started last week as an immediate support line. It was easily breached and has reverted to a resistance role.
0.8891 has weakened significantly in support, but managed to hold firm. It is a weak support line and could see further action early in the week.
0.8763 marked the low point of a US dollar rally in January, which began above the 0.90 level.
0.8550 has remained intact since December 2007.
0.8316 is the final support level for now. This line marked the start low point of a US dollar rally which saw the greenback climb above the 1.10 level.
I am bearish on AUD/USD.
The US dollar continues to enjoy strong gains and the Aussie has slipped below the psychologically significant 0.90 line., Will the shaky Australian dollar continue to tumble? The FOMC statement helped the greenback, and the guessing game as to the timing of a rate hike will soon heat up.
In our latest episode, we talk about the risk/reward ratio, the FOMC decision and what it means for the dollar and Chinese wobbles:
Subscribe to our podcast on iTunes.
- For a broad view of all the week’s major events worldwide, read the USD outlook.
- For EUR/USD, check out the Euro to Dollar forecast.
- For the Japanese yen, read the USD/JPY forecast.
- For GBP/USD (cable), look into the British Pound forecast.
- For the Australian dollar (Aussie), check out the AUD to USD forecast.
- USD/CAD (loonie), check out the Canadian dollar.
