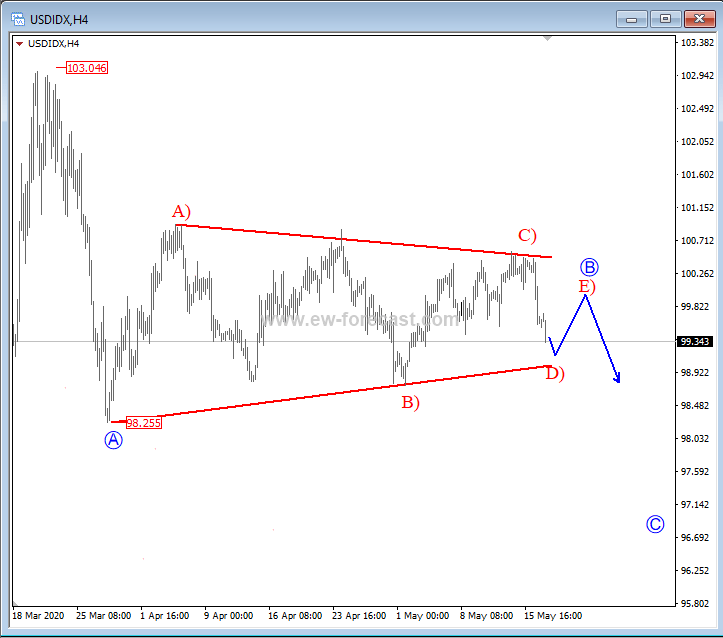
The USD index is trading sideways for some time now, ideally unfolding an Elliott wave triangle correction in wave B that is part of a three-wave corrective decline. A triangle is a continuation pattern, which has five legs in a sideways range, so a breakout is expected to occur lower after A-B-C-D-E subways; ideally in the same direction as previous wave A.
At the moment we see price making an intra-day decline, however, this may not be part of a wave C yet as waves D) and E) are still ongoing, meaning one more rally can be seen, before real bears take price lower and finally causes the breakdown.
USD Index, 4h
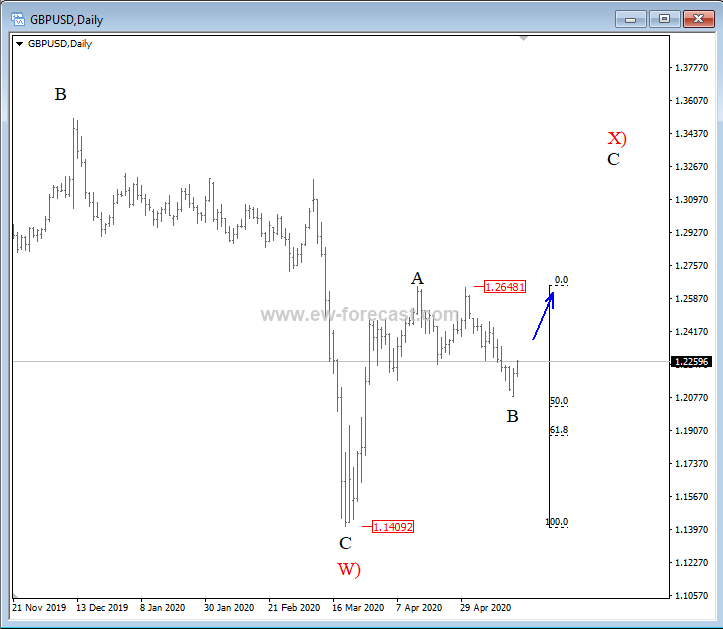
Well, if the USD Index is headed lower after that pattern unfolds, then cable can see more upside from current supports. In fact, on a daily chart, we see price in a possible higher degree recovery that should be made by three. And ideally, this recovery has a missing third leg up, which may resume away from current 50.0 and 61.8% Fibonacci levels, so wave B can be coming to an end.
GBPUSD, daily
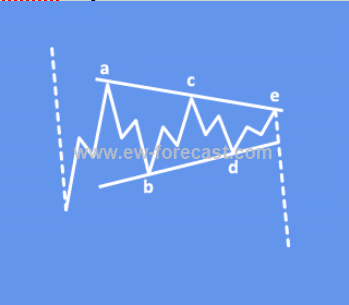
An Elliott Wave Triangle Formation
A Triangle is a common 5-wave pattern labeled A-B-C-D-E that moves counter-trend and is corrective in nature. Triangles move within two channel lines drawn from waves A to C, and from waves, B to D. A Triangle is either contracting or expanding depending on whether the channel lines are converging or expanding. Triangles are overlapping five wave affairs that subdivide 3-3-3-3-3.
Triangles can occur in wave 4, wave B, wave X position, or in some very rare cases also in wave Y of a combination.
An example of a symmetrical triangle in a downtrend: