The Canadian dollar enjoyed a good week, as USD/CAD dropped about 130 points. The pair closed at the round number of 1.04. This week’s major release is Building Permits. Here is an outlook on the major market-movers and an updated technical analysis for USD/CAD.
The Canadian dollar flexed some muscle late in the week, as Employment Change soared to 59.2 thousand, crushing the estimate of 21.2 thousand. In the US, PMI data looked good, but Non-Farm Payrolls fell short of the estimate.
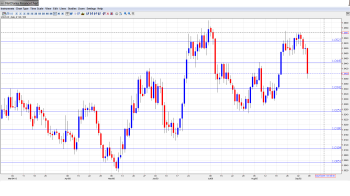
[do action=”autoupdate” tag=”USDCADUpdate”/]USD/CAD daily chart with support and resistance lines on it. Click to enlarge:
- Building Permits: Monday, 12:30. Building Permits is the only major release this week. The indicator tends to fluctuate sharply, resulting in estimates that are often off the mark. This as the case in the July release, as the indicator plunged 10.3%. The estimate stood at -2.5%. The markets are expecting a turnaround in August, with an estimate of a healthy 4.4% gain. Will the indicator follow through with strong reading?
- Housing Starts: Tuesday, 12:15. Housing Starts looks at the number of new residential homes that have undergone construction. The indicator has been fairly steady, with a reading in July of 193 thousand. This matched the forecast. The markets are not expecting much change, with an estimate of 190 thousand for August.
- NHPI: Thursday, 12:30. New Housing Price Index is an important housing inflation indicator. The index continues to post slight gains, and the July release showed a 0.2% gain, which fell short of the estimate of 0.3%. No change is expected in the August release.
- Capacity Utilization Rate: Friday, 12:30. This quarterly indicator looks at capacity utilization by industry, such as manufacturers, builders and utilities. The indicator tends to be fairly steady, which allows accurate market forecasts. The Q1 release came in at 81.1%, very close to the estimate of 81.3%. Little change is expected in the Q2 release, with an estimate of 81.3%.
* All times are GMT.
USD/CAD Technical Analysis
USD/CAD opened the week at 1.0536 and quickly touched a high of 1.0558. The pair then fell sharply, dropping below the 1.04 line and reaching a low of 1.0381, as support at 1.0340 (discussed last week) remained firm. USD/CAD closed the week at 1.0400.
Live chart of USD/CAD: [do action=”tradingviews” pair=”USDCAD” interval=”60″/]
Technical lines, from top to bottom:
We start with resistance at 1.0958, which is protecting the key 1.10 level. This line has remained intact since September 2009.
1.0853 is next. This line has held firm since May 2010.
1.0723 was a cap in mid-2010, before the US dollar tumbled and dropped all the way into 0.93 territory.
1.0660 is an important resistance line, which was last tested in September 2010.
1.0523 was a peak back in November 2011. It had provided strong resistance since July, but reverted to a support line earlier this month. It is back in resistance role after the pair dropped sharply this week.
1.0446 was a cap in mid-July, but has been providing support for the past several weeks. The pair easily broke through this line during the week and it is back providing resistance.
1.0340, which saw a lot of activity in July and August, is providing support.
1.0250 is next. This line has not been tested since July.
1.0180 provided support for the pair during March, and saw a lot of activity in the first half of June. The round number of 1.01 was a trough back in July 2012 and switched to resistance afterwards. The line proved its strength several times in 2013, most recently in mid-May.
1.0050 provided support for the pair in May 2013 and in other occasions beforehand. It remains a barrier before parity. The very round number of parity is a clear line and has provided support since mid-February.
The final support line for now is 0.9910. This line was last tested in January, which marked the start of a strong US dollar rally which saw USD/CAD climb to the mid-1.03 range.
I am bullish on USD/CAD
The Canadian economy has not looked sharp recently, and the strong employment change we saw last week will have to be backed up with other positive data before market sentiment improves. In the US, speculation that the Fed could taper QE as early as September is bullish for the US dollar, and overall the US economy continues to point in the right direction.
Further reading:
- For a broad view of all the week’s major events worldwide, read the USD outlook.
- For EUR/USD, check out the Euro to Dollar forecast.
- For the Japanese yen, read the USD/JPY forecast.
- For GBP/USD (cable), look into the British Pound forecast.
- For the Australian dollar (Aussie), check out the AUD to USD forecast.
- USD/CAD (loonie), check out the Canadian dollar.

