USD/CAD had a quiet week, and posted modest losses at the end the week. The pair closed at 1.0359. This week’s major releases are Manufacturing Sales and Core CPI. Here is an outlook on the major market-movers and an updated technical analysis for USD/CAD.
The Canadian dollar flexed some muscle late in the week, as Employment Change soared to 59.2 thousand, crushing the estimate of 21.2 thousand. In the US, PMI data looked good, but Non-Farm Payrolls fell short of the estimate.
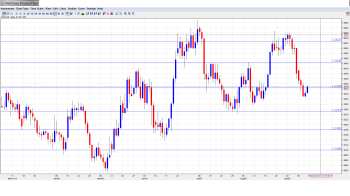
[do action=”autoupdate” tag=”USDCADUpdate”/]USD/CAD daily chart with support and resistance lines on it. Click to enlarge:
- Foreign Securities Purchases: Monday, 12:30. Foreign Securities Purchases is directly linked to currency demand, since foreigners must use Canadian dollars in order to purchase Canadian securities. The indicator looked awful in July, with a loss of -15.41 billion dollars. This was nowhere near the estimate of 7.77 billion. The markets are expecting a much smaller decline for the August release, with an estimate of -2.23 billion dollars.
- Manufacturing Sales: Tuesday, 12:30. This is the first key release of the week. Manufacturing Sales dropped 0.5%, in July, compared to a 0.7% gain the month before. The estimate stood at 0.5%. The markets are expecting a sharp turnaround, with an estimate of a 0.6% gain. Will the indicator meet or beat this rosy prediction?
- BOC Governor Stephen Poloz Speaks: Wednesday, 14:40. Poloz will address the Vancouver Board of Trade. Analysts will be looking for clues as to monetary policy or interest rate shifts in the speech. Any remarks which are “out of the ordinary” could affect the movement of USD/CAD.
- Wholesale Sales: Thursday, 12:30.Wholesale Sales disappointed with a sharp decline of -2.8% in July, its first decline since January. This was well off the estimate of -0.5%. The markets are expecting much better news for the August release, with an estimate of a 1.6% gain.
- Core CPI: Friday, 12:30. Core CPI is considered the most important inflation indicator. It is more reliable than CPI, since it removes the most volatile items that are included in CPI. The indicator has not shown much strength in recent readings, posting a flat 0.0% in July. This matched the market forecast. Little change is expected in the upcoming release, with an estimate of a weak 0.1% gain.
- CPI: Friday, 12:30. CPI continues to post weak gains, with a July reading of just 0.1%. This matched the estimate. No change is expected in the August release.
* All times are GMT.
USD/CAD Technical Analysis
USD/CAD opened the week at 1.0413 and touched a high of 1.0414. The pair then fell sharply, dropping all the way to 1.0306. USD/CAD closed the week at 1.0349, as the support line at 1.0340 (discussed last week) remained intact.
Live chart of USD/CAD: [do action=”tradingviews” pair=”USDCAD” interval=”60″/]
Technical lines, from top to bottom:
We begin with resistance at 1.0958, which is protecting the key 1.10 level. This line has remained intact since September 2009.
1.0853 is next. This line has held firm since May 2010.
1.0723 was a cap in mid-2010, before the US dollar tumbled and dropped all the way into 0.93 territory.
1.0660 is an important resistance line, which was last tested in September 2010.
1.0523 was a peak back in November 2011. It had provided strong resistance since July, but reverted to a support line earlier this month. It is back in resistance role after the pair dropped sharply this week.
1.0446 was a cap in mid-July, but has been providing support for the past several weeks. This line has some breathing room as the pair trades in the mid-1.03 range.
1.0340 is providing USD/CAD with weak support. This line was breached during the week but the Canadian dollar then recovered. 1.0250 is next. This line has not been tested since July.
1.0180 provided support for the pair during March, and saw a lot of activity in the first half of June. The round number of 1.01 was a trough back in July 2012 and switched to resistance afterwards. The line proved its strength several times in 2013, most recently in mid-May.
1.0050 provided support for the pair in May 2013 and on other occasions beforehand. It remains a barrier before parity. The very round number of parity is a clear line and has not been tested since mid-February.
The final support line for now is 0.9910. This line was last tested in January, which marked the start of a strong US dollar rally which saw USD/CAD climb to the mid-1.03 range.
I am bullish on USD/CAD
The Canadian economy continues to have trouble and has not been able to keep pace with its southern neighbor. In the US, speculation about QE tapering is bullish for the US dollar, and the FOMC could make a decision regarding QE at its meeting later this week. Until then, the uncertainty should be boost for the greenback, as investors stick with the safe-haven US dollar.
Further reading:
- For a broad view of all the week’s major events worldwide, read the USD outlook.
- For EUR/USD, check out the Euro to Dollar forecast.
- For the Japanese yen, read the USD/JPY forecast.
- For GBP/USD (cable), look into the British Pound forecast.
- For the Australian dollar (Aussie), check out the AUD to USD forecast.
- USD/CAD (loonie), check out the Canadian dollar.

