The New Zealand dollar extended its gains on hawkish expectations. The main event of the upcoming week is the release of quarterly GDP. Here is an analysis of fundamentals and an updated technical analysis for NZD/USD.
The Reserve Bank of New Zealand hiked the rates for the third time to 3.25% and did not leave the door closed for another rate hike in the upcoming meeting. With yield hungry investors, the kiwi jumped despite the desire of the RBNZ to see a lower currency and a potential intervention. Apart from rising against the dollar, it also reached a one year high against the euro. Can the pair push to multi-decade highs?
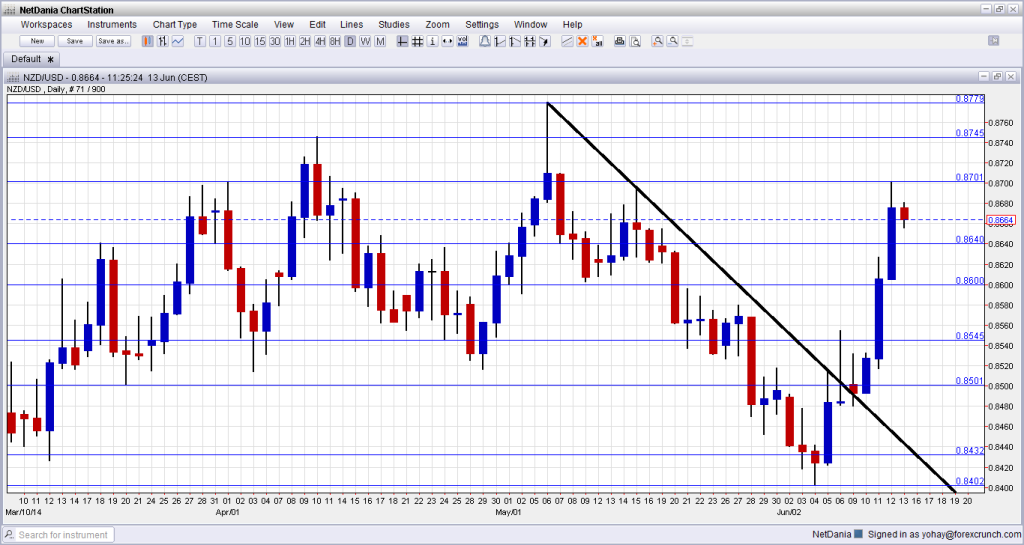
[do action=”autoupdate” tag=”NZDUSDUpdate”/]NZD/USD daily chart with support and resistance lines on it. Click to enlarge:
- Current Account: Tuesday, 22:45. The total difference between imports and exports remained negative in the last quarter of 2014, at a deficit of 1.43 billion NZD. This time, given some positive trade balance reports, another squeeze in the deficit is likely, and a surplus will not be a total surprise. And so, a positive figure of 1.42 is expected.
- GDP: Wednesday, 22:45. The total measure of the New Zealand economy showed slower growth in Q4 2014: 0.9% after 1.2% in Q3. For Q1 2014, a growth rate of over 1% is expected, reflecting the strong growth that led to the rate hikes. Expectations are high: 1.2%.
* All times are GMT.
NZD/USD Technical Analysis
Kiwi/dollar started the week with a continued recovery, settling above the 0.85 line (mentioned last week). It then steamed forward, breaking downtrend resistance and eventually bouncing off only at the 0.87 line.
Live chart of NZD/USD: [do action=”tradingviews” pair=”NZDUSD” interval=”60″/]
Technical lines, from top to bottom:
We start from higher ground this time: from the highest level in decades: 0.8840. This is the ultimate line of resistance. Above this point, only the round level of 0.90 awaits.
The previous 2014 peak of 0.8745 will be watched on any upside move. The round number of 0.87 proved its strength during May and joins the chart as key upside resistance.
The older swing high of 0.8640 worked as a pivotal line but eventually capped the pair. It is followed by the round number of 0.86, which worked as a cushion during May 2014.
The low of 0.8550 served as yet another pivotal line in the range. 0.85 is an important and very round number that looks like a clear separator of ranges.
0.8435 was the peak in September and was retested in January. It was a strong double top. 0.84, a round number, provided clear support in June.
0.8335 capped a move higher in December and also had a role in the past. The pair fell short of this line in January 2014.
Broken downtrend resistance
As the thick black line on the chart shows, downtrend resistance since reaching a peak in early May. The line was clearly broken now.
I remain bullish on NZD/USD
Despite the recent bumps, the New Zealand economy continues growing at a strong rate and is enjoying balanced growth and a determined central bank. Even though the US economy enjoys the same momentum, the calm environment allows for the higher yielding kiwi to emerge as a winner. A strong GDP print could certainly strengthen the kiwi, perhaps after some quick consolidation.
Further reading:
- For a broad view of all the week’s major events worldwide, read the USD outlook.
- For EUR/USD, check out the Euro to Dollar forecast.
- For the Japanese yen, read the USD/JPY forecast.
- For GBP/USD (cable), look into the British Pound forecast.
- For the Australian dollar (Aussie), check out the AUD to USD forecast.
- For USD/CAD (loonie), check out the Canadian dollar forecast.
