The US dollar continues to hammer the yen, as USD/JPY jumped about 160 points last week. The yen is in free-fall, having lost a staggering 900 points in the past three weeks. This week’s highlights are Preliminary GDP and the BoJ Monetary Policy Statement. Here is an outlook on the major events moving the yen and an updated technical analysis for USD/JPY.
US employment numbers disappointed last week, as jobless claims missed expectations and JOLTS softened. Still, there was a silver lining as the number of quits is back to pre-crisis levels, which shows that people are confident to switch jobs. Confidence is also apparent in the highest consumer confidence since 2007 and an improvement in retail sales. In Japan, manufacturing numbers were solid, but this didn’t provide any relief for the struggling Japanese currency.
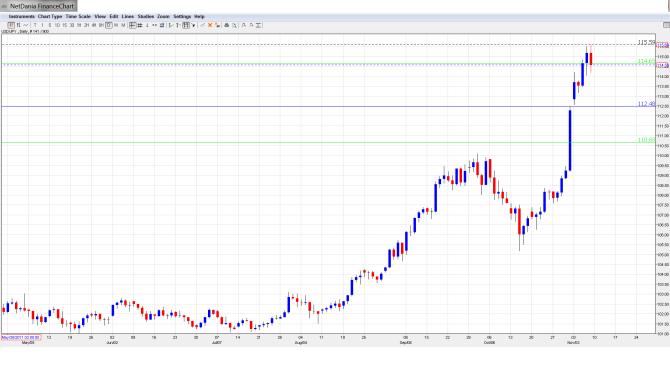
[do action=”autoupdate” tag=”USDJPYUpdate”/]USD/JPY graph with support and resistance lines on it:
- Preliminary GDP: Monday, 23:50. Preliminary GDP is one of the most important economic indicators and can have a major impact on the movement of USD/JPY. The indicator posted a sharp decline of 1.7% in Q2, but this did match the forecast. The markets are expecting a sharp turnaround in the upcoming reading, with an estimate of 0.5%.
- BoJ Monetary Policy Statement: Wednesday, Tentative. The BoJ caught the markets by surprise at the most recent policy meeting, when the BoJ unexpectedly raised monetary stimulus. The markets aren’t expecting a repeat, but will be closely monitoring this release.
- Trade Balance: Wednesday, 23:50. Japan continues to post trade deficits and last month’s deficit ballooned to JPY -1.07 trillion. This was well above the estimate of JPY -0.91 trillion. The markets are expecting an improvement in the upcoming release, with a forecast of JPY -1.02 trillion.
- Flash Manufacturing PMI: Thursday, 1:35. The PMI continues to post readings above the 50-point level, pointing to expansion in the manufacturing sector. Little change is expected in the October reading, with an estimate of 52.7 points.
- BoJ Monthly Report: Thursday, 5:00. The Bank’s monthly report is a minor event and is unlikely to have much impact on the direction of USD/JPY.
* All times are GMT
USD/JPY Technical Analysis
Dollar/yen started the week at 114.52 After touching a low of 113.86, the pair posted strong gains and broke above resistance at 116.66 (discussed last week), climbing to a high of 116.82. USD/JPY closed the week at 116.20.
Live chart of USD/JPY: [do action=”tradingviews” pair=”USDJPY” interval=”60″/]
Technical lines from top to bottom:
With the dollar posting strong gains, we start at higher levels:
121.39 was an important resistance line in December 2005.
119.88 follows. This line is the last barrier in front of the psychologically important 120 line. 117.94 is next.
116.66 had provided resistance since October 2006, but was tested last week, as the yen continues to lose ground.
114.65 was tested last week and is a weak resistance line. It has remained intact since December 2007, when the yen was in the midst of a strong yen rally which saw USD/JPY drop below the 96 line.
113.68 has switched to a support role as USD/JPY continues to move to higher levels.
112.48 started the week as a weak support line but has strengthened.
110.68 represented a high point of a strong dollar rally in August 2008, which started around the key 100 level. It is the final support level for now.
I am bullish on USD/JPY
US numbers remain strong, led by solid consumer spending and confidence numbers. Monetary divergence is proving bad news for the yen, which has taken a tumble since the BoJ increased monetary stimulus at its last policy meeting. With the markets smelling a yen at 120, the dollar’s huge rally could continue this week.
In our latest podcast, we dive into Australia, analyze the US jobs picture, talk about the punished pound and discuss the collapsing yen:
