USD/JPY was unchanged for a second straight week, closing at 117.47. There are six events this week. Here is an outlook on the major events moving the yen and an updated technical analysis for USD/JPY.
In the US, the Fed did not make any major changes in its statement, but did marginally upgrade the wording regarding the economy, noting that strong employment numbers had helped the economy. Data was mixed with disappointing durables, excellent jobless claims and a GDP which was missed expectations. In Japan, retail sales and consumer inflation matched expectations.
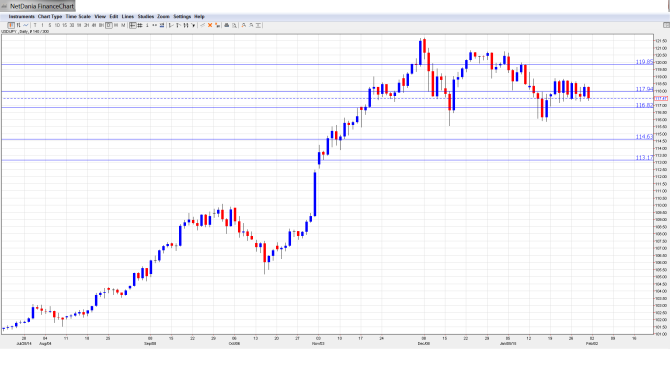
[do action=”autoupdate” tag=”USDJPYUpdate”/]USD/JPY graph with support and resistance lines on it:
- Final Manufacturing PMI: Monday, 1:35. The PMI remains slightly above the 50 point line, which separates contraction from expansion. More of the same is expected, with a forecast for January of 52.1 points.
- Monetary Base: Monday, 23:50. Monetary Base rose to 38.2% in December, well above the estimate of 34.3%. This was the indicator’s third straight rise. The upward trend is expected to continue in January, with an estimate of 40.1%.
- 10-year Bond Auction: Tuesday, 3:45. The yield on 10-year bonds slipped to 0.30% last in the January auction. Will the yield continue to drop in the upcoming release?
- Average Cash Earnings: Wednesday, 1:30. This is the major event of the week. The indicator, an important gauge of consumer spending, had a weak December with a decline of 1.5%. This was well off the forecast of a 0.5% gain. The markets are expecting a strong turnaround, with an estimate of 1.6%.
- 30-year Bond Auction: Thursday, 3:45. Yields on 30-year bonds have been dropping since mid-2014 and came in at 1.12% in the January auction. This is significantly lower than the yields of 1.71% in May and June.
- Leading Indicators: Friday, 5:00. This indicator is based on 11 economic indicators, but is a minor event since most of the data has been previously released. The estimate for the upcoming release stands at 105.5%.
* All times are GMT
USD/JPY Technical Analysis
Dollar/yen started the week at 117.42. The pair rose to a high of 118.66, before reversing directions and dropping to a low of 117.25, as support held firm at 116.82 (discussed last week). The pair closed the week at 117.47.
Live chart of USD/JPY: [do action=”tradingviews” pair=”USDJPY” interval=”60″/]
Technical lines from top to bottom:
124.16 marked the start of a yen rally in June 2007, which saw USD/JPY drop to the 96 level.
122.19 remains a strong resistance line which has held firm since July 2007. The next resistance line is 121.39.
119.88 held firm as the pair posted slight gains early in the week.
117.94 was tested for a second week during the week but recovered. It remains a weak resistance line.
116.82 held firm as the pair dropped close to this line. 116.02 is the next support level.
114.65 has remained intact since December 2007, when the yen posted a strong rally which saw USD/JPY drop below the 96 line.
113.17 is the final support level for now.
I am neutral on USD/JPY
The Federal Reserve signaled that an interest rate remains on track for later in the year, but GDP disappointed. The BOJ is expected to remain steady with its accommodating monetary stance as it tries to raise growth and inflation levels.
In our latest podcast, we do a Fed rundown analyze the Greek elections and discuss the suffering Aussie:
Further reading:
- For a broad view of all the week’s major events worldwide, read the USD outlook.
- For EUR/USD, check out the Euro to Dollar forecast.
- For GBP/USD (cable), look into the British Pound forecast.
- For the Australian dollar (Aussie), check out the AUD to USD forecast.
- For USD/CAD (loonie), check out the Canadian dollar forecast.
- For the kiwi, see the NZDUSD forecast.
