EURUSD Daily Pivots
| R3 | 1.1483 |
| R2 | 1.1403 |
| R1 | 1.1275 |
| Pivot | 1.1197 |
| S1 | 1.1068 |
| S2 | 1.0988 |
| S3 | 1.086 |
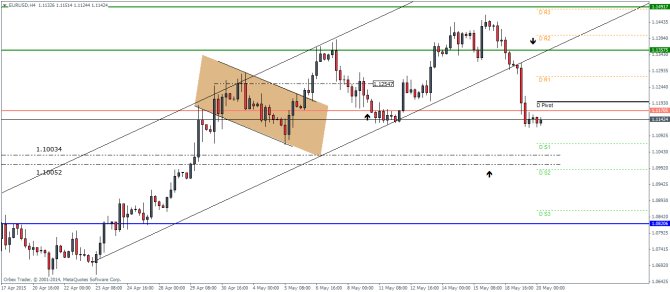
EURUSD (1.1138): EURUSD continued its decline yesterday posting second day of losses after the bearish engulfing candlestick formed earlier this week on Monday. On the intraday charts, after 1.13575 failed to support prices EURUSD promptly declined to 1.117 and is trading below this next support. Further downside is very likely with the next major support at 1.10034 through 1.10052 getting ready to be tested. A break below this could see a drop to 1.082 levels.
To the upside, price will have to establish support at 1.11705 in order to anticipate any gains to the upside with the previous broken support levels likely to come in as resistance.
USDJPY Daily Pivots
| R3 | 121.905 |
| R2 | 121.323 |
| R1 | 121.003 |
| Pivot | 120.413 |
| S1 | 120.101 |
| S2 | 119.511 |
| S3 | 119.191 |
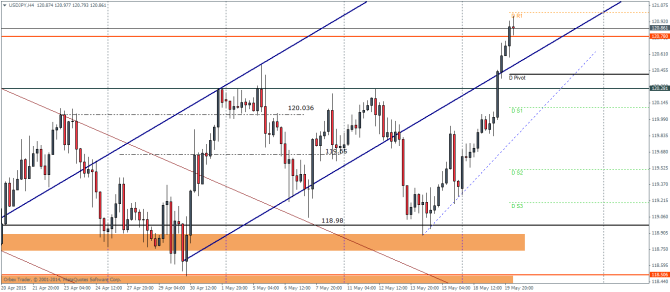
USDJPY (120.87): USDJPY continues to push along higher with three days of gains after the doji reversal candlestick that was formed around 14th May, 2015. On the intraday charts, price action managed to break above 120.28 and eventually broke higher ground, closing above 120.78. Price action needs to find support here in order to push higher, but the support at 120.28 is also a level that could be tested. To the upside 121.175 is likely to be the next level to the upside.
GBPUSD Daily Pivots
| R3 | 1.5859 |
| R2 | 1.5764 |
| R1 | 1.5636 |
| Pivot | 1.5542 |
| S1 | 1.5414 |
| S2 | 1.5317 |
| S3 | 1.5191 |
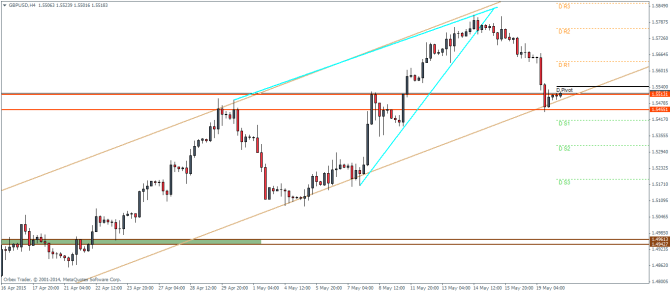
GBPUSD (1.552): GBPUSD has seen three straight days of declines and price is currently near 1.1552 support/resistance level. A daily close above this level is needed in order to ascertain further upside gains in the Cable. Failure to close above 1.1552 could see a possible test lower to 1.5324 on the daily charts.
Switching to the intraday charts, price action has been consolidating near the previous resistance level, which if prices hold could see a successful test of support. However, a break lower could see price fall out of the rising price channel and could see a sharp decline to 1.496.
