USD/CAD enjoyed another strong week, gaining about 150 points. The pair closed the week at 1.2453, its highest close since early April. This week’s major event is Employment Change. Here is an outlook on the major market-movers and an updated technical analysis for USD/CAD.
In the US, the dollar got a boost from strong core durables data and managed to weather weak GDP and employment numbers. The pair moved higher as Canadian GDP disappointed, posting a decline of 0.2%.
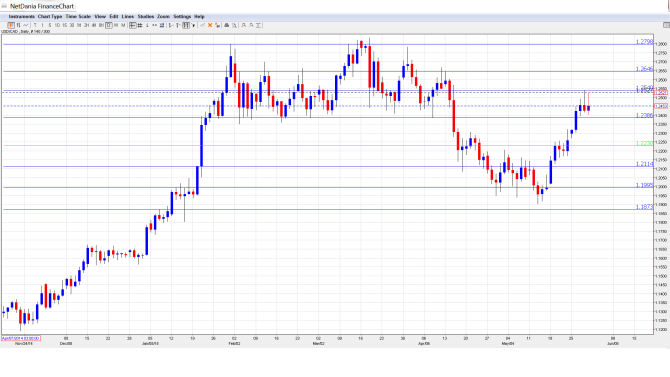
[do action=”autoupdate” tag=”USDCADUpdate”/]USD/CAD daily chart with support and resistance lines on it. Click to enlarge:
- Trade Balance: Wednesday, 12:30. Trade Balance is closely linked currency demand, as foreigners must purchase Canadian dollars in order to by Canadian exports. Canada has posted a string of five straight deficits. The March reading was unexpectedly weak, as the trade deficit posted a sharp decline of C$-3.0 billion, much worse than the forecast of C$-0.8 billion. Some improvement is expected in the April report, with a forecast of C$-2.0 billion.
- Ivey PMI: Thursday, 14:00. Analysts closely monitor PMIs, which are based on surveys of purchasing managers. The index shocked the markets with a superb April reading of 58.2 points, crushing the estimate of 50.1 points. Will the indicator repeat with another strong reading in May?
- Employment Change: Friday, 12:30. Employment Change is one of the most important economic indicators, and an unexpected reading can quickly affect the movement of USD/CAD. The indicator looked awful in April, coming in at -19.7 thousand. This was nowhere near the estimate of -4.5 thousand. The markets are expecting a strong turnaround, with an estimate of +10.2 thousand. The unemployment rate has been stuck at 6.8% for the past three releases, and no change is expected in the May report.
- Labor Productivity: Friday, 12:30. The week wraps up with labor productivity, a quarterly report which measures labor efficiency. The indicator declined by 0.1% in Q4, within expectations. The markets are expecting better news in Q1, with an estimate of a 0.1% gain.
USD/CAD Technical Analysis
USD/CAD opened the week at 1.2295 and quickly touched a low of 1.2273. The pair then moved upwards, touching a high of 1.2538, as resistance held firm at 1.2541 (discussed last week). The pair closed the week at 1.2453.
Live chart of USD/CAD: [do action=”tradingviews” pair=”USDCAD” interval=”60″/]
Technical lines, from top to bottom
We begin with resistance at 1.2924. This line was last tested in March 2009.
1.2798 is the next resistance line.
1.2646 has served as a cap since mid-April.
1.2541 held firm as the pair posted strong gains early in the week.
1.2387 is an immediate support line.
1.2230 has some breathing room after the US dollar rallied.
1.2114 is a strong support level.
1.1995, situated just below the symbolic 1.20 level, has remained intact since mid-May.
1.1872 is the final support level for now.
I am bullish on USD/CAD
The US dollar has gained close to four cents in May against the Canadian dollar, as the US economy continues to easily outperform its Canadian counterpart. If Canadian job numbers don’t impress this week, we could see the US dollar rally continue.
In our latest podcast, we explain the recent USD rally, what’s ahead and lots more
Subscribe to Market Movers on iTunes
Further reading:
- For a broad view of all the week’s major events worldwide, read the USD outlook.
- For EUR/USD, check out the Euro to Dollar forecast.
- For the Japanese yen, read the USD/JPY forecast.
- For GBP/USD (cable), look into the British Pound forecast.
- For the Australian dollar (Aussie), check out the AUD to USD forecast.
- For the kiwi, see the NZDUSD forecast.
