EURUSD Daily Pivots
| R3 | 1.142 |
| R2 | 1.1317 |
| R1 | 1.1234 |
| Pivot | 1.1131 |
| S1 | 1.1048 |
| S2 | 1.0945 |
| S3 | 1.0862 |
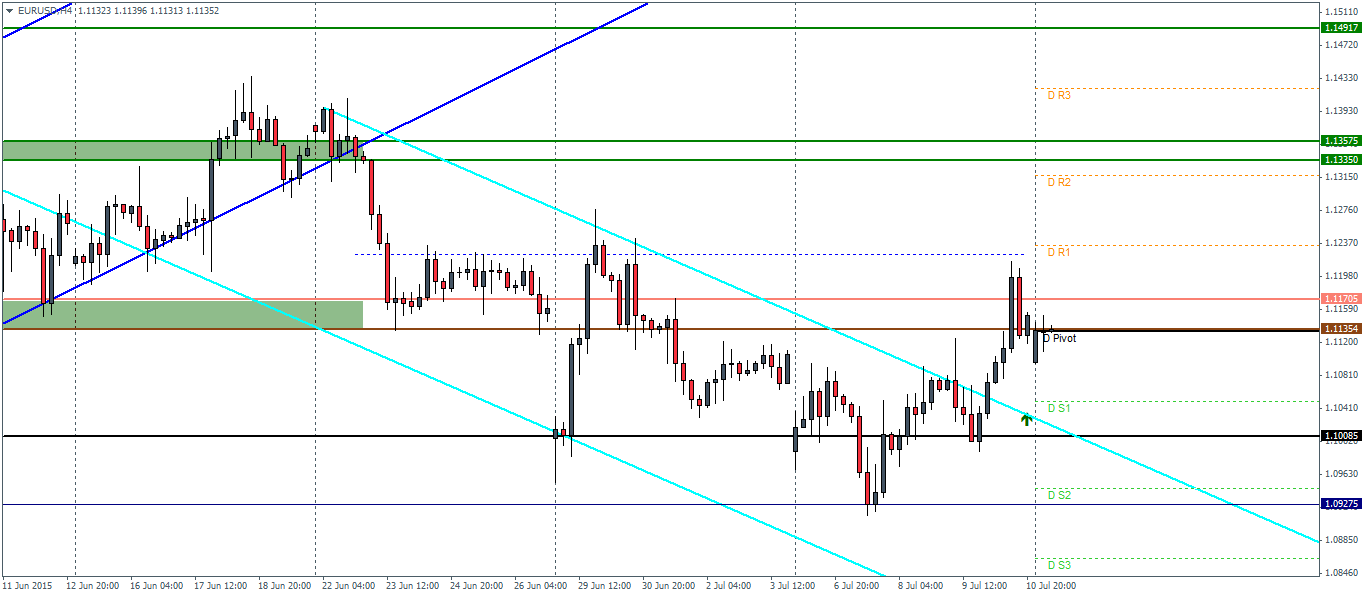
EURUSD (1.113): EURUSD formed a bullish engulfing on Friday’s close and it is likely that we can see some upside price action for the next day or two. Despite price action opening lower, EURUSD managed to fill the gap today and is trading near the support/resistance zone of 1.117 – 1.1135 region. Price needs to clear this level in order to test the next resistance at 1.1335. To the downside, we could expect prices to hold near the previous support at 1.10.
USDJPY Daily Pivots
| R3 | 124.91 |
| R2 | 123.88 |
| R1 | 123.318 |
| Pivot | 122.295 |
| S1 | 121.71 |
| S2 | 120.70 |
| S3 | 120.119 |
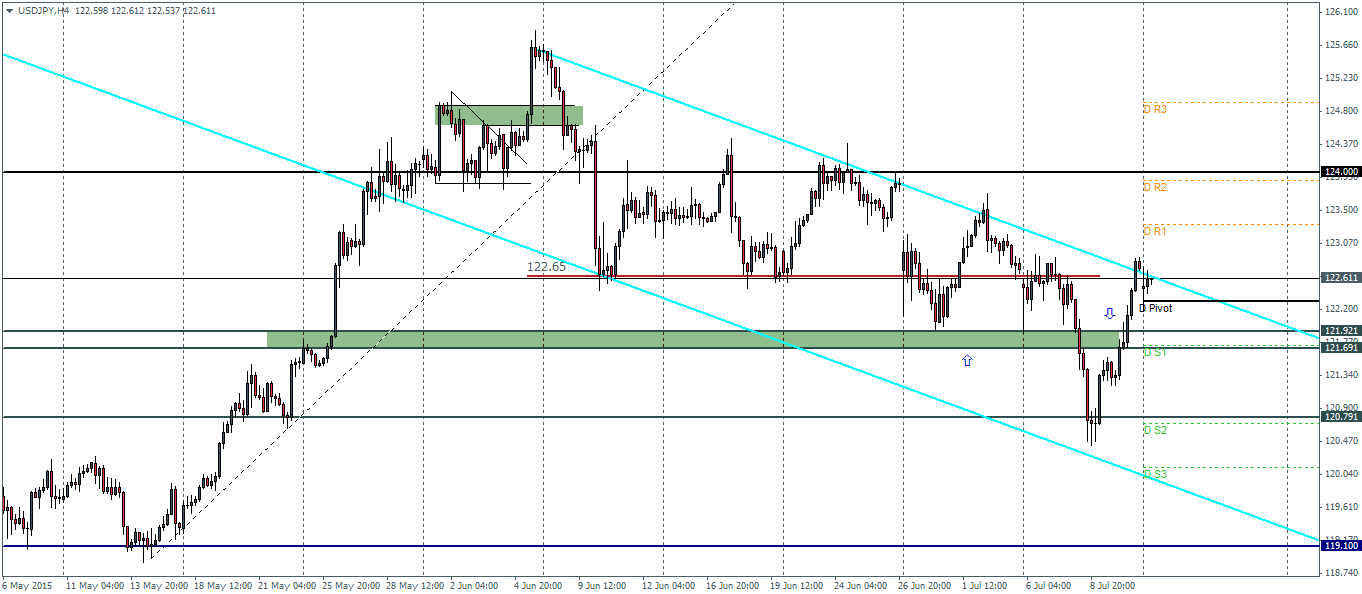
USDJPY (122.63): USDJPY has closed the past two daily sessions on a bullish note. However, the intraday charts shows price struggling to break above the trend line of the falling price channel. Any weakness to the downside could be tested near the support/resistance level of 122 region. A break out to the upside could test the 124 resistance, while the risks to a downside break out remains limited to 122 – 121.7 level of support and resistance.
GBPUSD Daily Pivots
| R3 | 1.5774 |
| R2 | 1.5663 |
| R1 | 1.5586 |
| Pivot | 1.5475 |
| S1 | 1.5401 |
| S2 | 1.5287 |
| S3 | 1.5213 |
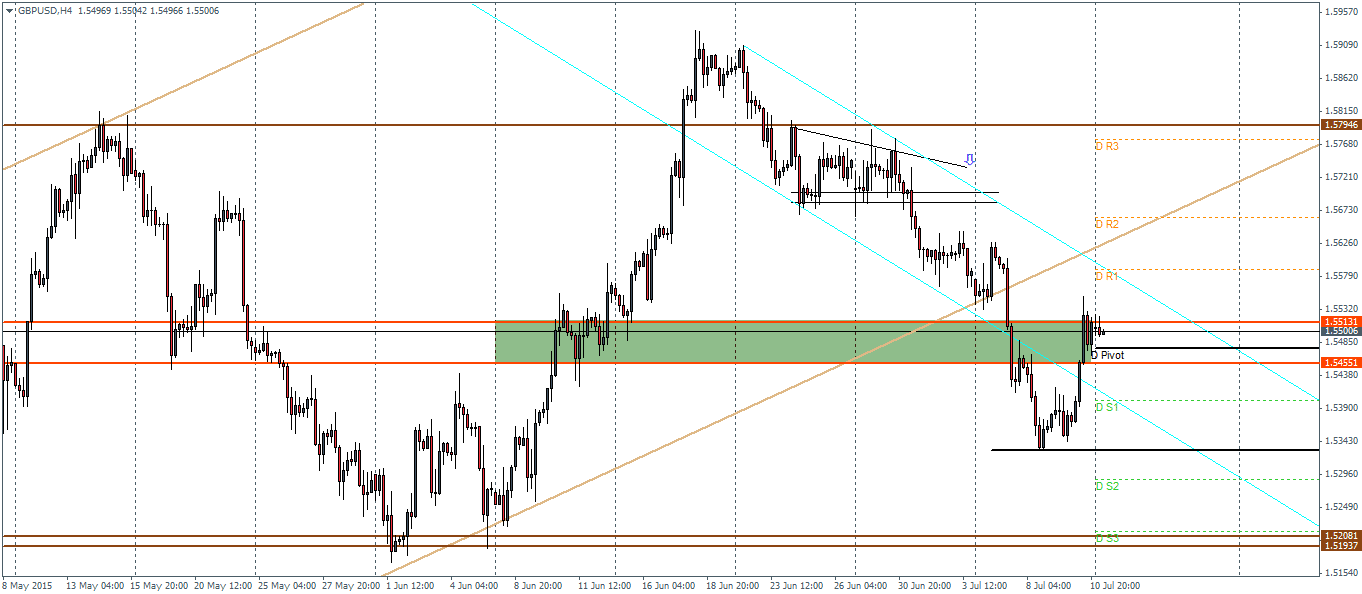
GBPUSD (1.55): The bounce in the GBPUSD since Thursday saw price reach back to 1.552, which was a support/resistance level previously. If prices fail to close above this level, GBPUSD could decline back to a proper test of support near 1.533 – 1.523 region. On the intraday charts, price is back trading in the major support/resistance zone of 1.552 – 1.5455. We could expect some sideways price action to prevail ahead of a break out. A minor support has been formed at 1.533 which, if not tested could signal a potential break out to the upside from the falling price channel.
