EURUSD Daily Pivots
| R3 | 1.1179 |
| R2 | 1.1119 |
| R1 | 1.1024 |
| Pivot | 1.0963 |
| S1 | 1.0869 |
| S2 | 1.0808 |
| S3 | 1.0714 |
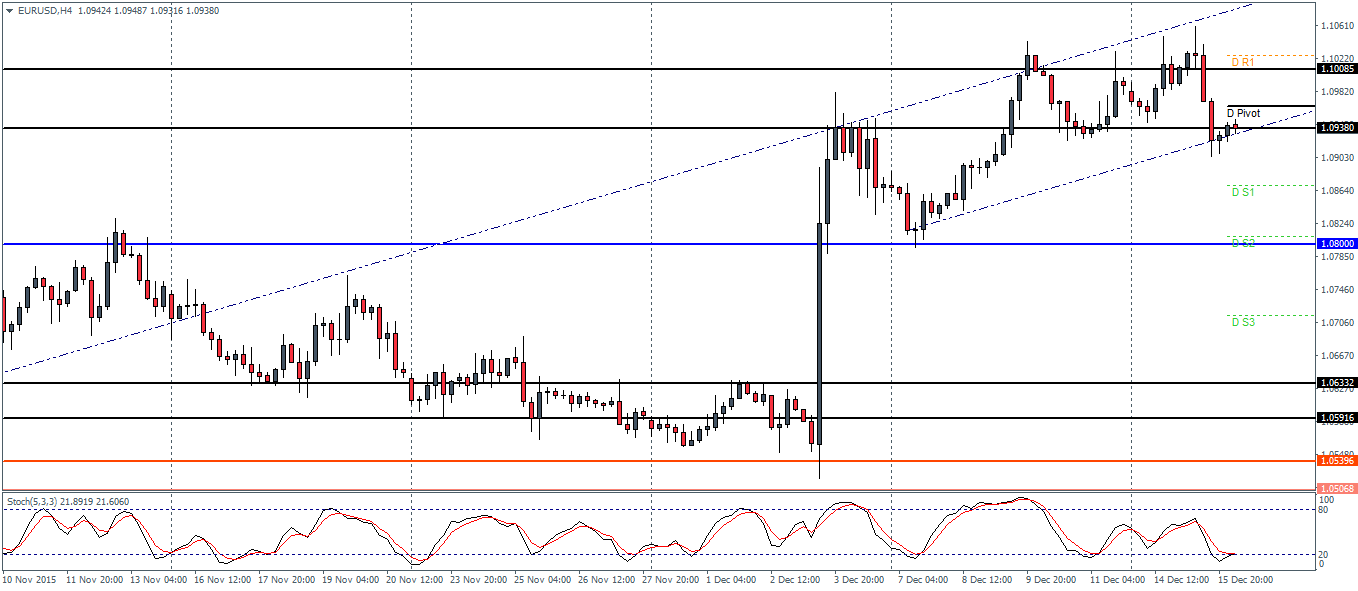
EURUSD (1.09): EURUSD closed on a bearish note yesterday following the previous daily session’s spinning top pattern. The close below the previous day’s low of 1.0945 indicates further downside in the near term with a test to support at 1.0825 – 1.08 very likely. On the 4-hour chart, price action has failed to form a higher high and in the process, broke below the most recent higher low of 1.0945. Expect a short term bounce back to this low and if prices fail to push any higher, EURUSD could be looking to a sharp decline down to 1.08. A break below 1.08 could expose the lower support near 1.0633 – 1.06 region.
USDJPY Daily Pivots
| R3 | 123.330 |
| R2 | 122.559 |
| R1 | 122.115 |
| Pivot | 121.343 |
| S1 | 120.891 |
| S2 | 120.121 |
| S3 | 119.672 |
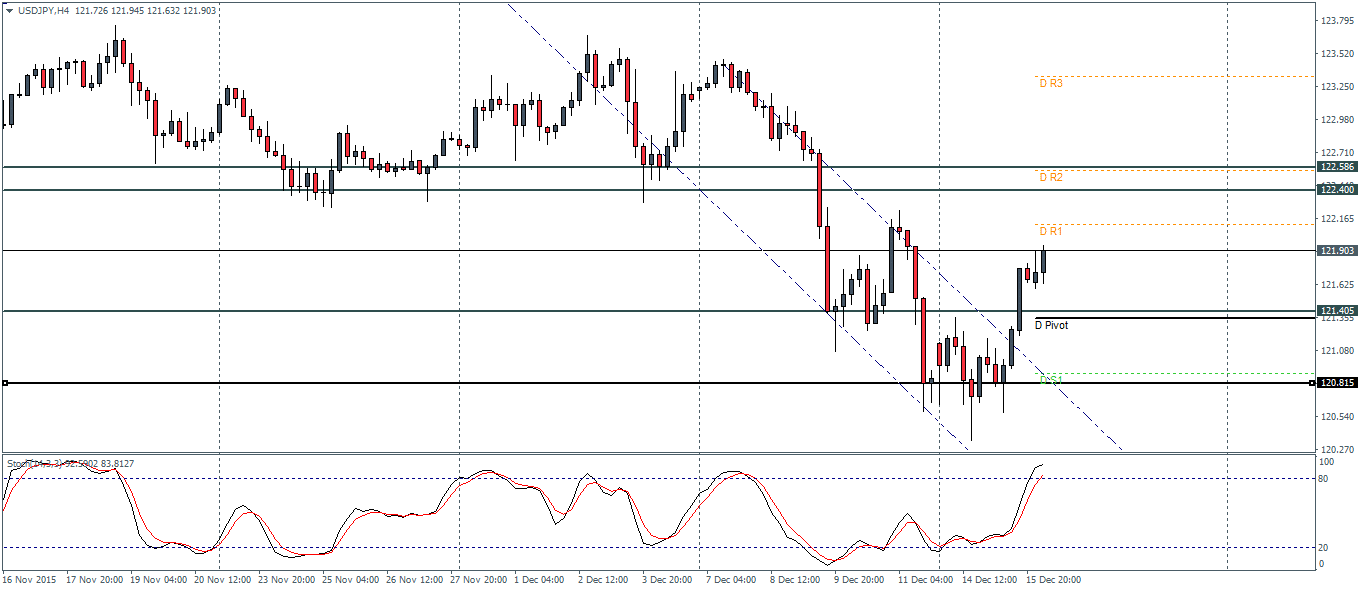
USDJPY (121.8): USDJPY has reversed higher and the price action pattern from the past three days shows a bullish reversal based off yesterday’s strong bullish price action. With prices trading above 121.484, USDJPY could be aiming for a push higher to 122.4 region. In the near term, a dip to 121.48 could establish support ahead of a move higher. On the 4-hour chart, with the falling price channel being broken, USDJPY has broken out strongly with little to no retracement. A test to 122.4 without establishing support could open up the risk of a false move higher, with an impending retest down to 121.4 support.
GBPUSD Daily Pivots
| R3 | 1.5296 |
| R2 | 1.5241 |
| R1 | 1.5140 |
| Pivot | 1.5084 |
| S1 | 1.4984 |
| S2 | 1.4928 |
| S3 | 1.4828 |
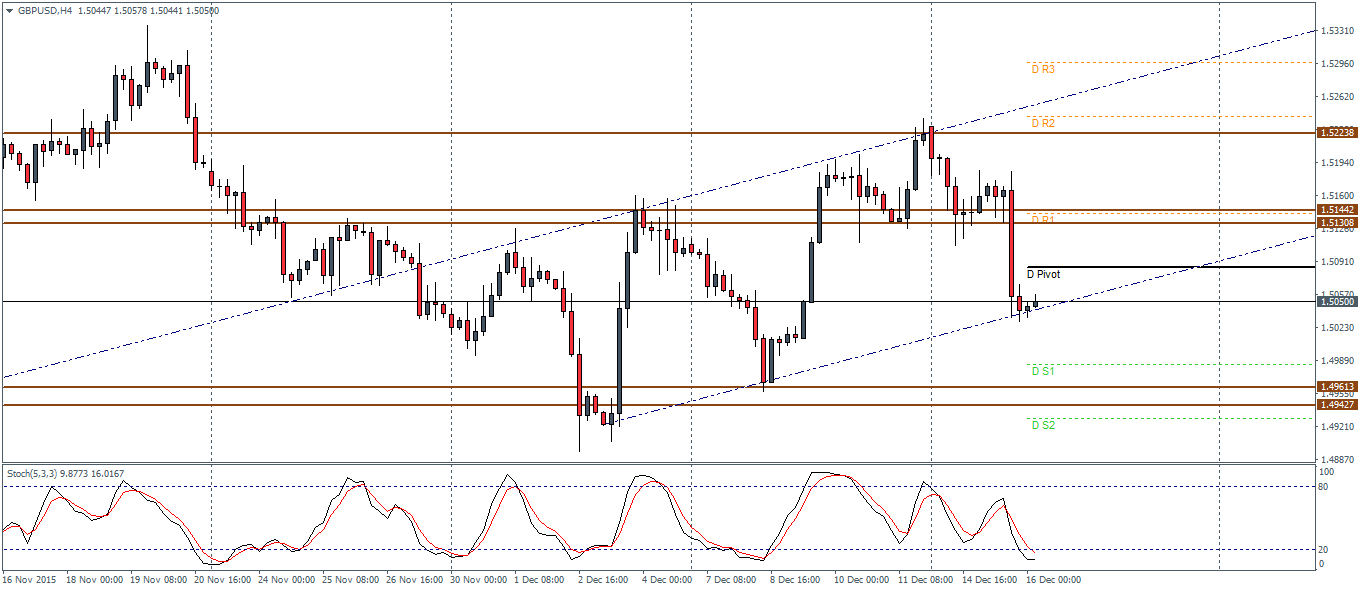
GBPUSD (1.50): GBPUSD continues to consolidate below the 1.512 – 1.509 level of support on the daily chart. However, prices have managed to form consecutive higher highs and higher lows which could signal a move to the upside if prices break above 1.512, while to the downside, a test to 1.50 – 1.49 remains a possibility. On the 4-hour chart, prices are trading near the lower trend line of the price channel after breaking the support/resistance near 1.5144 – 1.5130 region. If the dynamic support holds, GBPUSD could attempt a rally to the 1.5144 – 1.513 price level to establish resistance and eventually decline lower down to 1.496 – 1.494 support.
