EURUSD Daily Analysis
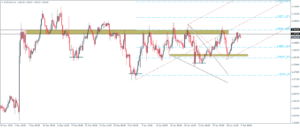
EURUSD (1.091): EURUSD continued its ascent after testing down to the previous support near 1.0816 – 1.0834 support to rally back to the neckline resistance of the inverse head and shoulders pattern formed on the 4-hour chart. Failure to clear the resistance between 1.095 – 1.093 could signal another leg lower down to 1.0867 and could potentially start to invalidate the inverse head and shoulders pattern. The move to the downside could see a decline to as low as 1.0735 lows formed around the 5th – 7th January and could potentially expose the lower support to 1.0625 that was formed in early December last year.
USDJPY Daily Analysis
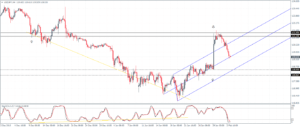
USDJPY (119.5): USDJPY is now into the third day of declines after rallying to 121.25 resistance. Price action is likely to dip lower to 118.0 – 118.5 level of support. The bias in USDJPY remains to the upside as long as the support holds, which could see another attempt to break above the previous resistance level. Alternatively, in the event of a break below 118.0 – 118.5 support, further declines are likely. Price action is currently trading near the Median line which could offer a short term dynamic support. A retest back to 120.52 cannot be ruled out but as long as prices remain below 120.52, a test to 118 – 118.5 is very much possible. The 4-hour Stochastics oscillator is currently in the oversold levels, indicating a short term bounce very likely and confirming a possible rally to 120.520.
GBPUSD Daily Analysis
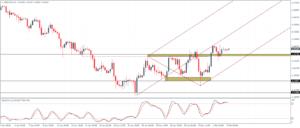
GBPUSD (1.44): Price action formed a near hammer pattern on the daily chart while the hidden bearish divergence still remains in play, indicating a move to the downside. On the 4-hour chart, GBPUSD is supported above 1.4375 – 1.436 support level, but failure to rally higher is likely to see the momentum exhausting. A dip below the support is likely for GBPUSD to retest the previous lows near 1.4183 – 1.421. The series of doji candlesticks being formed currently continue to show indecision in the market but opens the potential to a break out in either direction.
Gold Daily Analysis
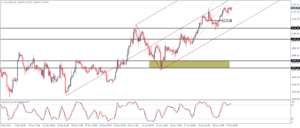
XAUUSD (1128): Gold prices closed in a doji candlestick pattern yesterday after briefly testing $1130. A daily close below the doji’s low at $1122.41 could potentially signal a move to the downside. The Stochastics oscillator is also failing to print higher highs pointing to a potential bearish divergence which could see prices correct lower to 1080 on break below 1100 handle. Alternatively, watch for 1117.16 support, which if holds could send Gold prices potentially back to the current levels near $1130, if not higher.
