EURUSD Daily Analysis
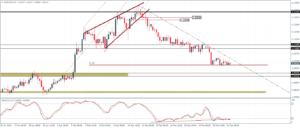
EURUSD (1.10): EURUSD continued its declines with prices briefly breaking below 1.10 handle. Prices have been trading off this level for the past few sessions on the 4-hour chart. A break below 1.10 could see a slip to 1.095/1.093 support while to the upside, the break of the falling trend line will see a correction to 1.1105 – 1.113 to retest the broken support level for resistance. The upside bias continues to fade quickly as the Euro posts decline steadily. Price action on the daily chart closed with a small-bodied candle yesterday and, therefore, any signs of a pullback to the declines will be seen on a break above yesterday’s highs of 1.1052
USDJPY Daily Analysis
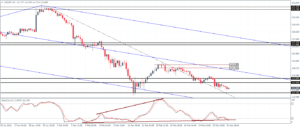
USDJPY (111.8): USDJPY is back trading near the 112 handle, but the daily chart shows the Stochastics could b pointing to a bullish divergence, which could be confirmed only on a close above yesterday’s high of 113.054. On the 4-hour chart, we can see that the Stochastics oscillator is currently posting a higher low against the lower low in prices. Resistance at 113 – 112.5 is key for any hints of an upside correction. A break above this region could confirm a stronger more to the upside for 117. To the downside, 111.31 marks the previous low and a break below this level could see further downside in USDJPY.
GBPUSD Daily Analysis
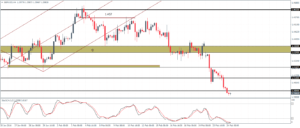
GBPUSD (1.398): GBPUSD broke the 1.40 handle yesterday with another day of declines. Price action remains bearish with no signs of any correction to the upside. Currently trading at 1.398, the next level of support comes in at 1.38, marking the support off April 2001. Any corrective moves to the upside could see GBPUSD being sold off as 1.41 will be the likely resistance if GBPUSD manages to close above 1.40 handle.
Gold Daily Analysis
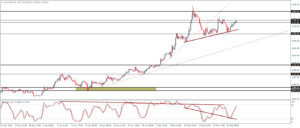
XAUUSD (1225): Gold prices turned bullish yesterday on risk aversion and prices are back near the gap at 1227. For the moment, there is a strong bearish divergence being formed with the daily Stochastics marking a lower high. With prices back in the identified resistance level, Gold prices could be limited to the upside. A break below 1200 will confirm a stronger decline down to 1130 followed by 1110.
