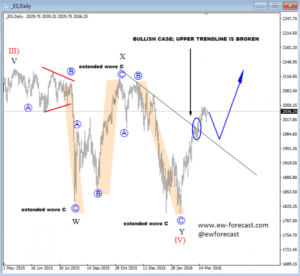
Stocks recovered very nicely and sharply since mid-February so it looks like the bullish reversal is here. Notice that the decline since June of 2015 was overlapping so it was a clearly corrective wave, a double zigzag that formed wave IV) near 1800. That said, the price could go straight up to new highs especially if we consider a broken trendline as our confirmation for a bullish scenario. In the mid-term however, traders should be aware of a corrective retracement back to around 2000 level where trendline and psychological levels can turn into a support.
S&P500, Daily
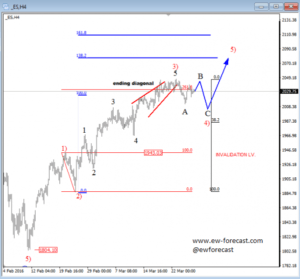
On the lower time frame, E-mini S&P500 has been trading higher recently, above 2000 important psychological level so we assume that the price is making an impulsive recovery. The fifth subwave of an extended wave 3) made a top formation last week, but only temporary as the current retracement is likely to be another correction within the uptrend. We are tracking red wave 4) that can retrace even back to 1970-1980 region where new a bounce may happen at the start of April, after a visible A-B-C setback.
S&P500, 4H