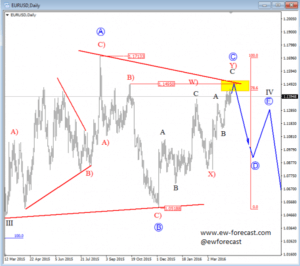
EURUSD was moving higher in March reaching levels around 1.1400 at the end of the month which means that the recent push up is part of a complex correction from 1.0518. We see a structure with seven legs, a double zigzag that represents wave C-circled as part of a big ongoing triangle that is now in play for more than 12 months. However, despite uncompleted big wave IV we think that the upside will be limited and that a new bearish turn could occur in April, probably down into wave D-circled from current 1.1450-1.1500 resistance zone highlighted on daily chart.
EURUSD, Daily
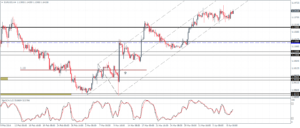
Lower time frame shows that EURUSD has turned up in mid-March making a bullish the price structure much more complicated. We are looking at the big blue wave C-circled, that is part of a big triangle of a higher degree, so the upside can be limited soon if we consider sub-waves on the 4h chart. We are looking at a double zigzag from March 14th low that can be in late stages now. However, there is still room for 1.1500-1.1550 area where the pair can be looking for a top formation later this week.
EURUSD, 4H