EURUSD Daily Analysis
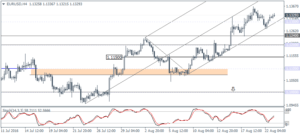
EURUSD (1.132): The price action in EURUSD yesterday closed in a fake break out from the inside bar with prices seen settling back above the inside bar’s low of 1.1284 and also filling the gap formed on Monday’s open. On the 4-hour chart, the price is seen retracing the losses, but so long as a lower high is formed, the bias remains for a test to 1.120. The Stochastics on the 4-hour chart is signaling a potential bearish divergence with a lower high as well, validating this view. Watch for a close below 1.130, which could trigger declines to 1.1240 and eventually to 1.120.
USDJPY Daily Analysis
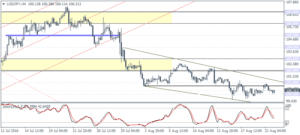
USDJPY (100.31): Despite opening with a gap, USDJPY closed bearish yesterday with prices seen trading near the 100.00 price level. As noted yesterday, 100.50 minor resistance remains a key level that needs to be breached for USDJPY to see any upside in prices. The next main resistance level at 102.00 remains to the upside. The Stochastics on the 4-hour chart is confirming the consolidation within the falling wedge pattern, and thus any potential upside is seen only above 100.50 – 101.00 resistance level. Below 100.00, USDJPY could be seen posting fresh declines with 99.00 the next immediate level of interest.
GBPUSD Daily Analysis
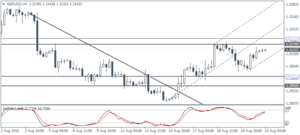
GBPUSD (1.314): GBPUSD has been flat for the past three daily sessions, trading within 1.32 and 1.30 levels. However, resistance near 1.32 – 1.317 remains a strong level that needs to be cleared for any valid gains to remain in place. In the near term, GBPUSD is most likely to remain range bound with a breakout of 1.32 or 1.30 likely to keep the momentum going.
Gold Daily Analysis
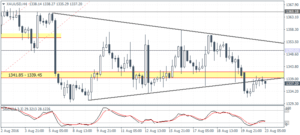
XAUUSD (1337.20): Gold prices tested a new 2-week low yesterday to 1331.86 before recovering modestly. Still, the price action on the daily chart marks a bearish bias following the failure to break above 1350 – 1360 resistance zone. On the 4-hour chart, gold prices remain flat, but support is seen at 1327.50 while resistance at 1340 is likely to cap any gains to the upside. There is also a potential symmetrical triangle formed on the H4 chart, which confirms the bearish bias to 1327.50 followed by 1315.00.
