EURUSD Daily Analysis
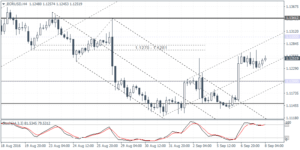
EURUSD (1.1251): EURUSD has formed what looks like a spinning top pattern near the lower high. On the daily chart, price action is also showing a potential head and shoulders pattern with the right shoulder currently formed near yesterday’s high. A bearish follow through here, and a breakdown towards 1.1100 could signal further downside to 1.0900. On the 4-hour chart, price action is showing consolidation near the current levels with resistance at 1.1270 – 1.1280 likely to be tested. As long as prices remain below 1.1300, the daily chart’s head and shoulders pattern could signal further downside.
USDJPY Daily Analysis
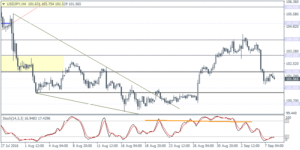
USDJPY (101.56): USDJPY tested an 8-day low to 101.20, but price action is still likely to push lower to test 101.00 – 100.80 support level. A retest here could mark the completion in the correction with USDJPY likely to push higher from here on. To the upside, watch for 104.00 as the initial resistance followed by a test to 106.00 resistance level. To the downside, if USDJPY breaks below 100.80 on a daily basis, the further downside could be seen with a test to 100.00 quite likely.
GBPUSD Daily Analysis
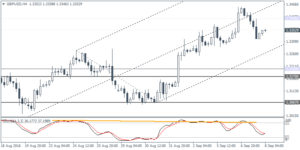
GBPUSD (1.3352): GBPUSD was bearish yesterday with prices forming an inside bar near 1.3400. Failure to breakout to the upside could keep GBPUSD biased to the downside for a test towards 1.3200 support level. On the 4-hour chart price action has broken below 1.3400 after forming a pivotal high near 1.3445. A lower high back to 1.3400 could signal a continuation to the downside targeting 1.3200. In the event that prices break above 1.3400 and threatens the previous high, further upside could be seen.
Gold Daily Analysis
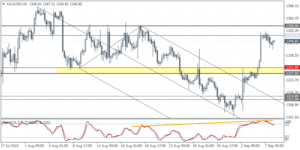
XAUUSD (1346.85): Gold prices pulled back after testing 1350 handle yesterday, and the daily chart price action is showing a descending triangle pattern with the neckline support seen at 1300 – 1315. As long as 1360 is not breached, the bias remains to the downside, in which case further declines could be seen coming. On the 4-hour chart, the hidden bearish divergence continues to remain in play with support at 1331 – 1327.50 likely to be tested in the near term. Also, note the potential inverse head and shoulders pattern that could be formed following the test of resistance at 1356 – 1350 on the 4-hour time frame. A reversal near 1331 – 1327.50 could potentially see gold prices break out towards posting new highs.
