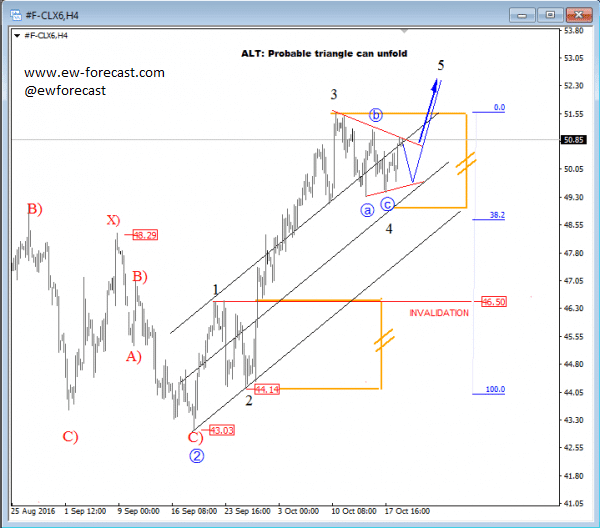
Crude oil turned into a big bullish mode in September which looks like an impulsive price move on the 4h chart. The reason is an extended and sharp leg from 44.14 to 51.50 that looks like wave 3 of an impulsive structure. If that’s true, then we know that market is in new bullish phase so uptrend should continue after wave four pullback. Fourth waves are corrective waves that will typically retrace for 38.2% compared to wave 3, which in our case comes in around 49.00 area, so we think this region can be hit before price turns up for wave 5.
However, if the price will stay sideways then we also need to have an alternate view, with a possibility that the wave four correction can unfold as an EW triangle and later continue in the same way, higher.
Invalidation level is at 46.50; as long this swing top of wave one is not reached we are bullish.
Crude OIL, 4H
A Triangle is a typical five wave pattern labeled A-B-C-D-E that moves counter-trend and is corrective in nature. Triangles move within two channel lines drawn from waves A to C, and from waves B to D. A Triangle is either contracting or expanding depending on whether the channel lines are converging or expanding. Triangles are overlapping five wave affairs that subdivide into 3-3-3-3-3.
Basic Triangle Pattern: