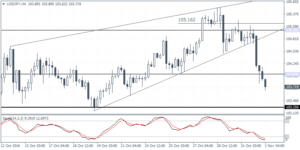
On the daily chart of USDJPY we are observing a nice impulsive decline taking place, with the price now trading in one of its temporary corrective sub-waves, wave 4-circled. If that is the case, then the current sideways price action could suggest that we are dealing with a triangle correction, a continuation pattern that can push the price towards the 96.00 area, once the pattern is completed.
USDJPY, Daily
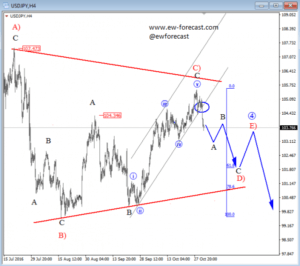
Regarding the lower time frame, USDJPY dropped sharply yesterday well below the channel support connected from September low which suggests that the market completed a five wave rally up in wave C of C). This decline is also very aggressive, so we believe it’s a part of a bigger three wave drop that can continue even to 101-102 area for wave D) based on an Elliott Wave triangle count that can be taking place in wave four of a higher degree.
USDJPY, 4H
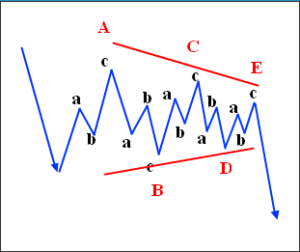
A Triangle is a common 5 wave pattern labeled A-B-C-D-E that moves counter-trend and is corrective in nature. Triangles move within two channel lines drawn from waves A to C, and from waves B to D. A Triangle is either contracting or expanding depending on whether the channel lines are converging or expanding. Triangles are overlapping five wave affairs that subdivide into 3-3-3-3-3.
Basic Triangle Pattern: