EURUSD Daily Analysis
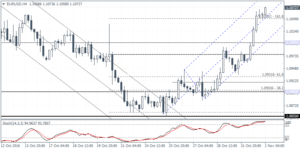
EURUSD (1.1072): The single currency surged ahead yesterday despite a quiet economic calendar from the euro zone. The US ISM manufacturing PMI as well as Markit’s manufacturing gauge both beat estimates but the data did little to stem the dollar’s decline. The gains in the euro came after price managed to break out from the 1.1000 – 1.0975 resistance level. EURUSD looks poised to challenge the 1.1100 resistance level that lies ahead with the scope to test higher towards 1.1150. Besides the FOMC statement, the ADP payrolls report will be seen as an additional catalyst for the markets today. To the downside, EURUSD looks well supported at the recently broken resistance level of 1.1000 – 1.0975 which could attract more buyers into the market, keeping the single currency well supported in its target to 1.1100.
USDJPY Daily Analysis
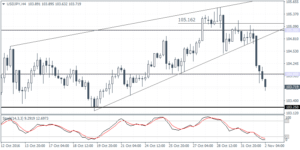
USDJPY (103.71): USDJPY finally gave up its gains near 105.16 – 105.00 and broke down from the rising wedge pattern. The declines extended down towards 104.00 support as the dollar is now likely to test the next main support at 103.25 – 103.00. The upside looks fairly limited to 104.00, but a breakout above this price level could see the gains extend the retracement back to the 105.00 region. Despite this possibility, USDJPY remains biased to the downside towards the 103.00 price level with the possibility of a decline down to 102.00. The Stochastics on the 4-hour chart is currently oversold which could keep the dollar range bound against the yen.
AUDUSD Daily Analysis

NZDUSD (0.7228): The Kiwi is looking to capitalize on a weaker greenback and better than expected labour market data. At the time of writing, the kiwi is seen rising to a 9-day high, trading near $0.7228. As noted in the daily commentary a few days ago, the NZDUSD is chalking out a head and shoulders pattern. Short-term resistance is seen at 0.7265 – 0.7233, marking the high of the previously marked high of the right shoulder. A breakout above this resistance could keep NZDUSD on par for more gains. However, in the event of a price reversal near this resistance level, the NZDUSD could be seen pushing lower in the coming weeks. Neckline support is seen at 0.7046 – 0.6982 which will act as the immediate support that could see price bouncing off this level.
