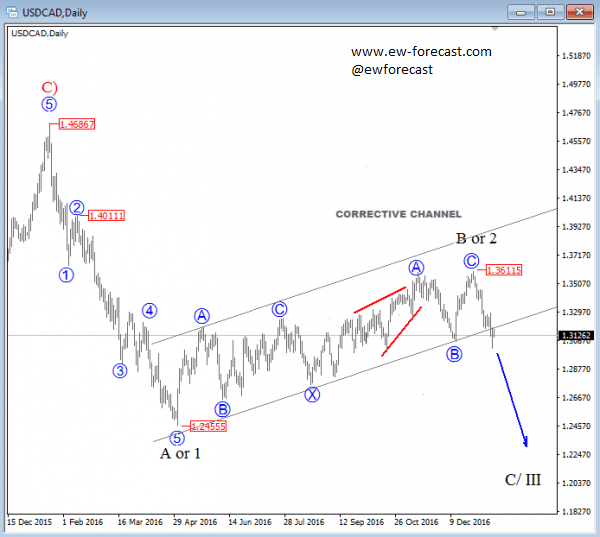
USDCAD is currently trading lower, specifically at the 1.3126 level after a probable top had been posted some days before the end of the old year. We are talking about sub-wave C of B or II. That said, if that is the case then more weakness should follow in weeks ahead within higher degree wave C or III. A breach beneath the lower corrective channel line and beneath the 1.3069 level would indicate more weakness to follow.
USDCAD, Daily
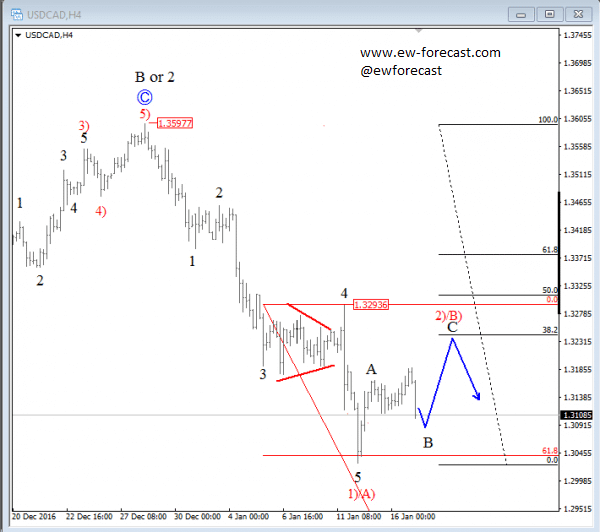
On the lower degree chart, USDCAD is still turning sharply down from a new high that was reached at the end of December near the 1.3600 level. This impulsive drop we labeled as an ongoing wave 1) or A) that appears finished based on a turn up from our Fibonacci projection level the past week. Intraday recovery is sharp, like a small impulse that belongs to a new three wave temporary rally. We are tracking red wave 2)/B) which can revisit 1.3250-1.3300 resistance area before downtrend resumes this week.
USDCAD, 4H