XAUUSD intra-daily analysis
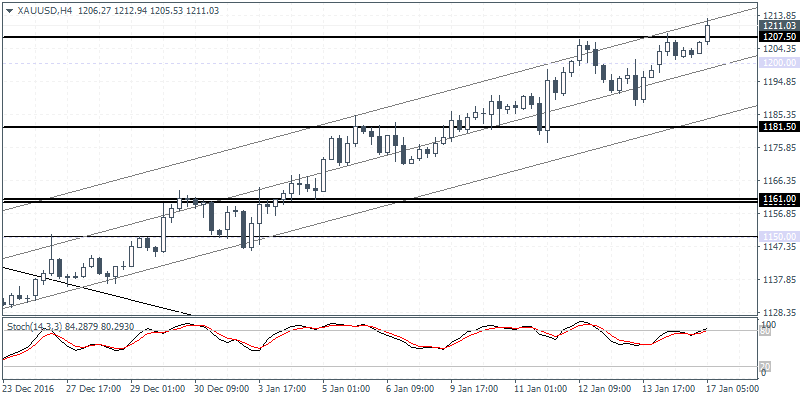
XAUUSD (1211.03): Gold prices closed above 1200.00 on a bullish note with today’s open comfortably above this key resistance level. The next main resistance is seen near 1250.00, but the daily Stochastics is firmly pointing to a hidden bearish divergence pattern which signals an imminent correction in the near term. On the 4-hour chart, gold is seen attempting to test the 1210 – 1207 resistance level, but the Stochastics is signaling a bearish divergence here which indicates a correction towards 1181.50. However, gold prices need to close below 1200.00 to validate the bearish outlook. Alternately, a continuation above 1207 – 1210 could signal further gains coming although 1200.00 will need to be tested for support to ascertain further gains.
USDJPY intra-day analysis
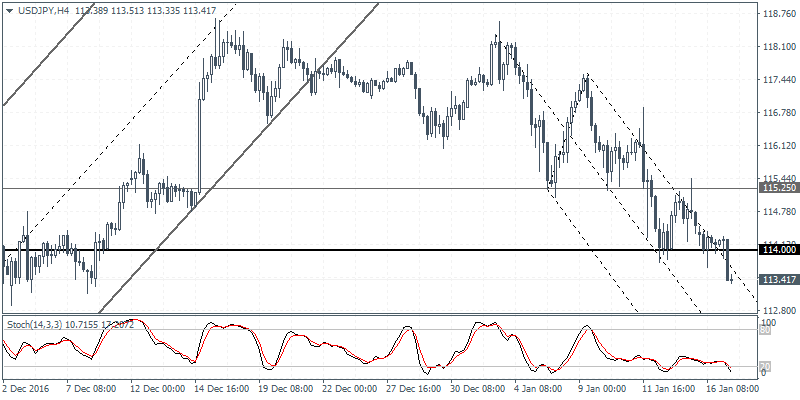
USDJPY (113.41): USDJPY bounced off the 114.00 handle yesterday, but the declines accelerated, resulting in price breaking down the 114.00 support with a strong bearish candlestick. This could indicate further near-term continuation in prices, although 114.00 could be retested in the very short term. The 4-hour Stochastics shows a bullish divergence at the current levels which also signals a near term upside move in USDJPY towards 114.00 initially followed by a test towards 115.25.
USDCHF daily analysis
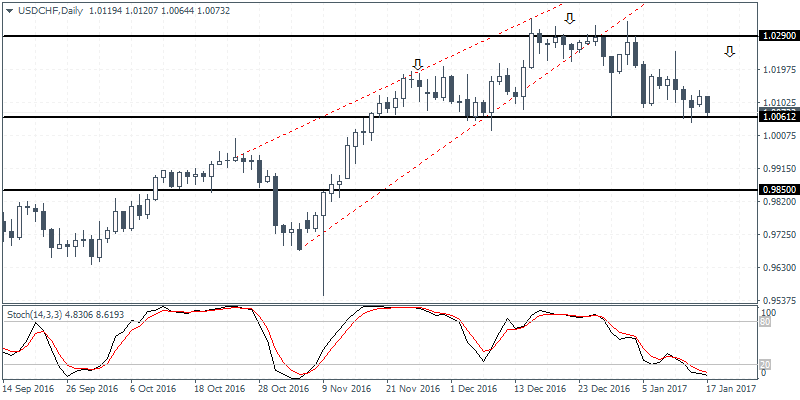
USDCHF (1.0073): USDCHF is approaching the support level at 1.0061 which was previously tested around late November. If this support level holds out, USDCHF could potentially bounce back higher, in the process, price action is likely to carve out a potential head and shoulders pattern, as long as the previous highs near 1.0290 is not breached. To the downside, if the head and shoulders pattern is validated, USDCHF could be looking towards posting a correction towards 0.9850 marking the minimum measured move to the downside. However, this is all speculative as USDCHF is still in the early process of forming the head and shoulders pattern.
