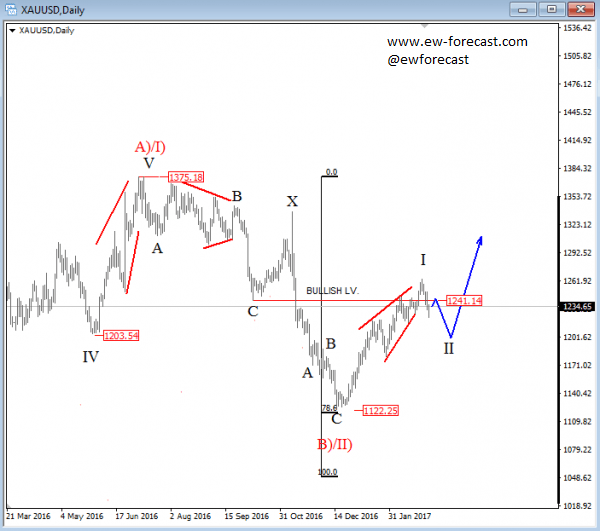
Gold is trading higher, probably at the start of a higher degree impulse in wave C) or III). If that is the case, then the correction in wave B) or II) found a base at the 78.6 Fibonacci ratio. A decisive break above the 1241.18 level would suggest higher levels to follow. That said, now we see the price trading at the start of wave II.
GOLD, Daily
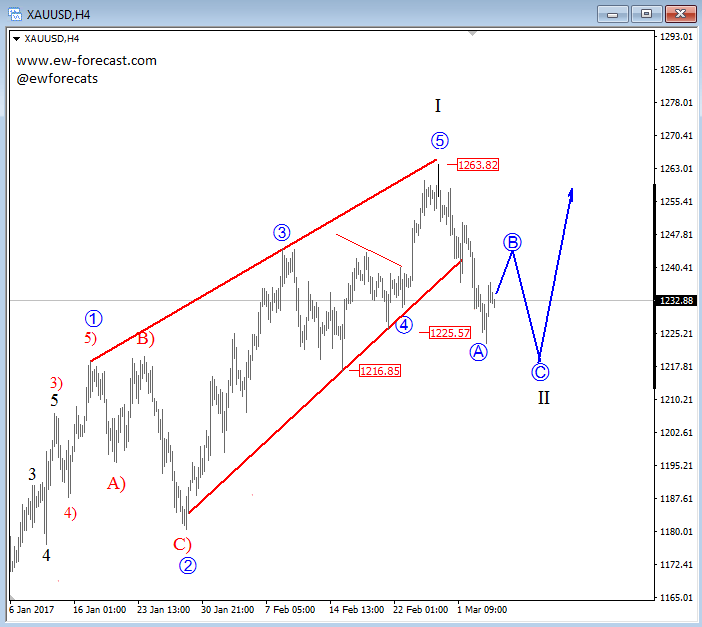
On the 4h chart of Gold, we can see that the metal made a strong reversal last week, below the trendline from the end of January, after touching the upper resistance line on Monday. Well, we see a wedge pattern since the start of the year which can be a leading diagonal placed in wave I position. We know that’s still an important structure for a change in trend, so despite a new look we will remain bullish. However, before bulls may resume we must be aware of a three-wave retracement, ideally back to 1210/1215 area where the metal can be looking for a new support.
GOLD, 4H