GBPJPY has been turning bullish for the last few weeks, with an impulse up as wave A) shown on the daily chart, which means that the market is in a bigger three wave recovery. Regarding the 4h chart, we see the price trading in a five-wave complex pattern within wave B) that is also known as a triangle correction. Now, we see the price trading in one of its legs, in sub-wave D, with an ideal reversal zone around the upper triangle line. A decisive breach above the 140.41 level would indicate a completed consolidation and more upside to follow.
GBPJPY, 4H
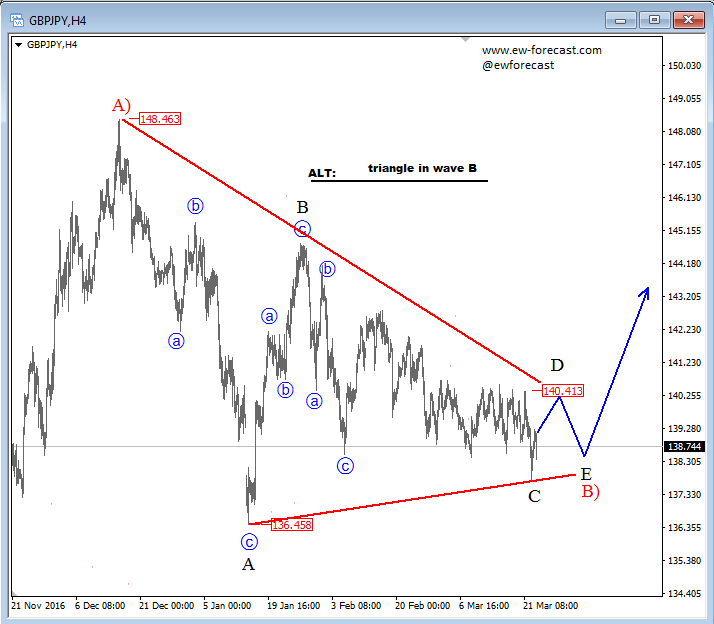
Triangles are overlapping five wave affairs that subdivide 3-3-3-3-3. They appear to reflect a balance of forces, causing a sideways movement that is usually associated with decreasing volume and volatility.
Elliott Wave triangle correction: