The Australian dollar had a turbulent amid key figures and it struggled to rise. Will it break out of range? The inflation report is clearly the big event of the upcoming week. Here are the highlights of the week and an updated technical analysis for AUD/USD.
The meeting minutes from the RBA did not provide any clarity on an upcoming move by the central bank. It seems that the current policy will continue for quite some time. The Australian economy gained nearly 20K jobs in September, beating expectations. Nevertheless, the Aussie hardly budged. China’s economy grew by 6.8%, as expected, and this did not rock the boat. The US dollar received support from the Fed and also from a step forward on tax reform.
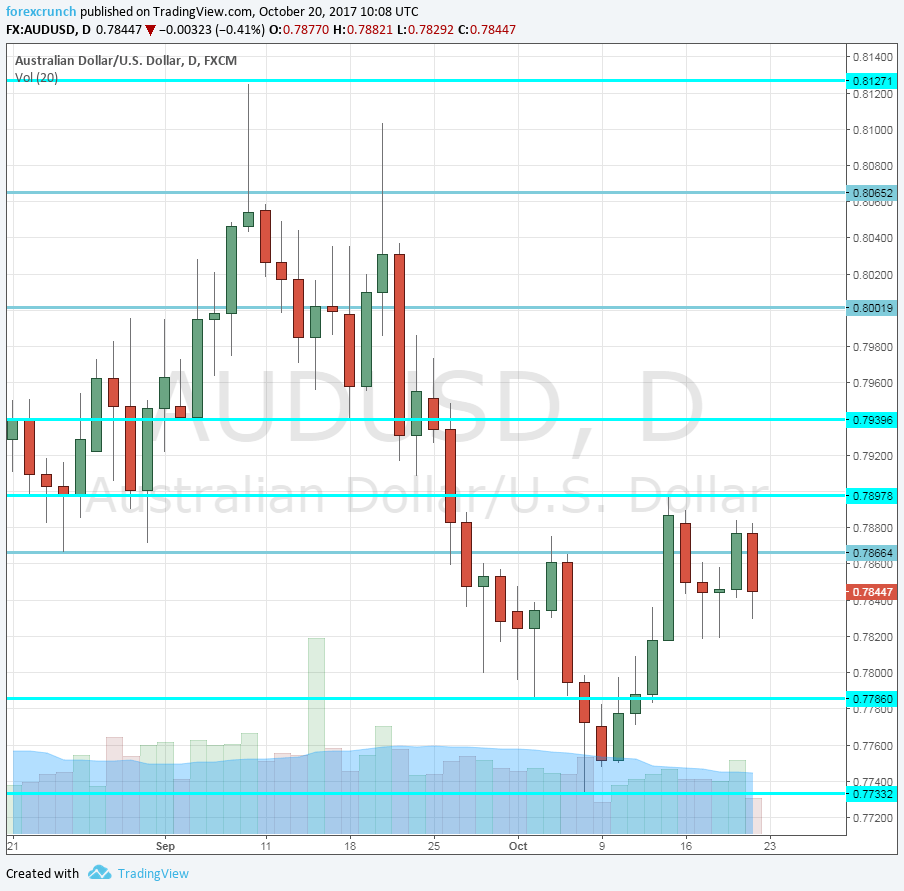
[do action=”autoupdate” tag=”AUDUSDUpdate”/]AUD/USD daily graph with support and resistance lines on it. Click to enlarge:
- CB Leading Index: Monday, 2:30. This compound indicator takes 7 indexes into consideration, most of them already published. A rise of 0.1% was recorded in July. We now get figures for August.
- CPI: Wednesday, 00:30. Australia publishes its inflation figures only once per quarter, making every event quite substantial. Headline CPI advanced by only 0.2% in Q2 2017, falling short of expectations. The Trimmed Mean CPI (known as Core inflation in other places) rose by 0.5% as expected. Any indication that inflation remains weak would weigh on the Aussie and imply higher chances of a rate cut in 2018. Headline CPI is predicted to rise by 0.8% while core CPI is likely to advance by 0.5% once again.
- Import Prices: Thursday, 00:30. Prices of imported goods feed into consumer prices. Prices dropped by 0.1% in Q2. The publication has a bigger impact when it is made before the CPI data.
- Guy Debelle talks: Thursday, 7:45. The RBA Assistant Governor gives a speech about uncertainty in Sydney. Despite the not-so-promising title of his talk, he has moved the A$ in the past and can do it again now.
- PPI: Friday, 00:30. The producer price index, like the CPI, is published only once per quarter. It used to be released before the CPI, serving as a meaningful warm-up. As it is released only once per quarter, it still has a significant impact on the Aussie despite the late publication. An advance of 0.4% is on the cards.
AUD/USD Technical Analysis
The Australian dollar slid early in the week, finding support at the 0.7860 level mentioned last week.
Technical lines from top to bottom:
The high of 2017 at 0.8125 is the top level. 0.8065 is the previous 2017 high.
It is followed by the psychological round level of 0.80. Below, we find 0.7940, which capped the pair in August.
0.7860 served as support during September and is another line to watch. 0.7785 was a stepping stone on the way up.
Below, we find 0.7740, that was a high point in June 2017 and also beforehand. 0.7635 was a stepping-stone on the way up, also in June.
Even lower, we find 0.7565 was a low point before the pair shot higher in July. The last line, for now, is 0.7515.
I am bearish on AUD/USD
The RBA is neutral but has a slight tendency to lower interest rates. They could get a boost from weak inflation figures.
Our latest podcast is titled Black gold shining and comparing QEs
Follow us on Sticher or iTunes
Further reading:
- EUR/USD forecast – for everything related to the euro.
- GBP/USD forecast – Pound/dollar predictions
- USD/JPY forecast – projections for dollar/yen
- USD/CAD forecast – Canadian dollar analysis
- Forex weekly forecast – Outlook for the major events of the week.
Safe trading!

