GBP/USD is trading at lower levels as PM May makes her last attempt to pass the Brexit deal by separating the Withdrawal Agreement from the Political Declaration. Her chances look slim and GBP/USD has room to fall.
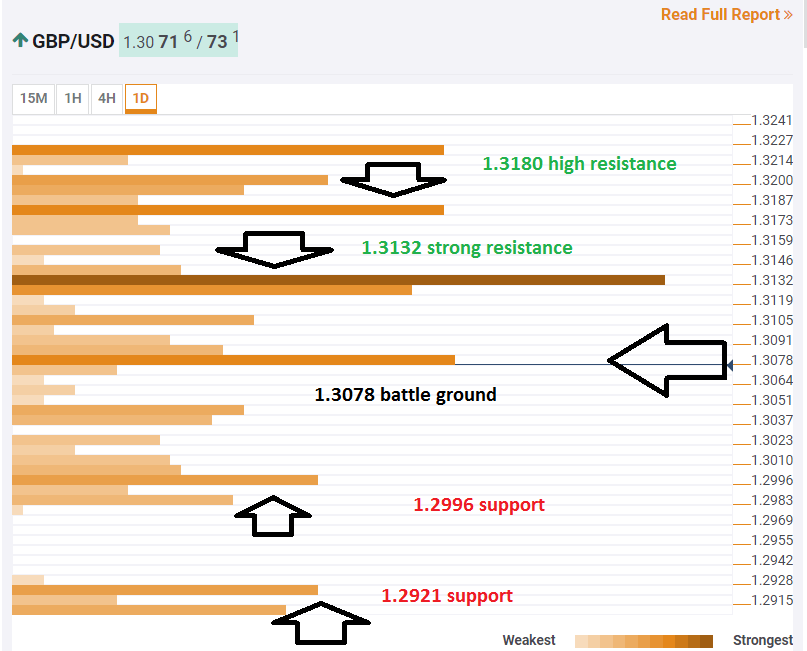
The Technical Confluences Indicator shows that cable is battling a cluster of technical levels at 1.3078 where we see the Simple Moving Average 5-15m, the previous 4h-high, the Bollinger Band 15min-Upper, the Fibonacci 23.6% one-week, and the SMA 5-4h.
Looking up, significant resistance awaits at 1.3132 where we see the convergence of the Fibonacci 38.2% one-month, the BB 1h-Upper, the Fibonacci 38.2% one-week, the SMA 4h, and the SMA 10-4h.
Further above, the next cap is at 1.3080 which is the meeting point of the SMA 100-1h, the SMA 100-1h, and the BB 4h-Middle.
Looking down, notable support is only at 1.2996 which is where the Pivot Point one-day Support 1 and the Fibonacci 61.8% one-month converge.
The next support line is only at 1.2921 which is the confluence of the PP one-day S2, the SMA 100-one-day, and the PP one-month Support 1.
This is how it looks on the tool:
Confluence Detector
The Confluence Detector finds exciting opportunities using Technical Confluences. The TC is a tool to locate and point out those price levels where there is a congestion of indicators, moving averages, Fibonacci levels, Pivot Points, etc. Knowing where these congestion points are located is very useful for the trader, and can be used as a basis for different strategies.
This tool assigns a certain amount of “weight” to each indicator, and this “weight” can influence adjacents price levels. This means that one price level without any indicator or moving average but under the influence of two “strongly weighted” levels accumulate more resistance than their neighbors. In these cases, the tool signals resistance in apparently empty areas.
