GBP/USD kicked off the week with gains thanks to a better market mood, upbeat UK data and also hopes for a Brexit resolution. However, the indicative votes may be disappointing amid resistance, and the pair also faces technical resistance.
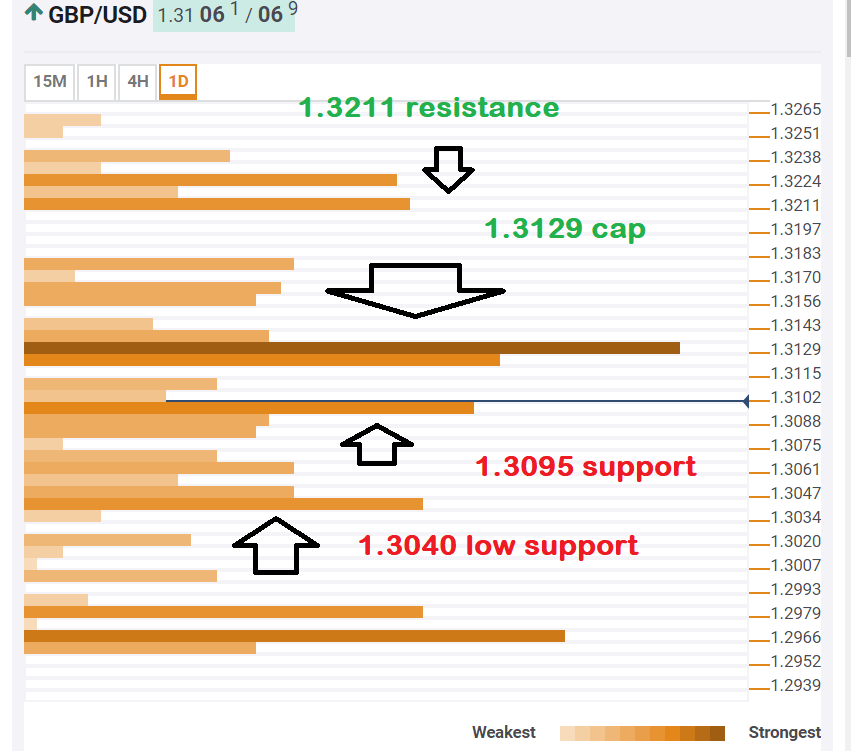
The Technical Confluences Indicator shows that cable faces significant resistance at 1.3129 where we see the convergence of the Simple Moving Average 200-4h, the Pivot Point one-day Resistance 1, and the Fibonacci 38.2% one-month.
If GBP/USD can break higher, the next cap is at 1.3211where we see the Pivot Point one-day Resistance 2, the PP one-week R1, and the Fibonacci 61.8% one-month.
Looking down, support is close, at 1.3095 which is the confluence of the Fibonacci 38.2% one-week, the Bollinger Band 1h-Upper, and the previous 15-low converge.
The next considerable support line is at 1.3040 where the BB 1h-Middle, the SMA 5-4h, and the Fibonacci 38.2% one-day converge.
All in all, support looks weaker than resistance.
This is how it looks on the tool:
Confluence Detector
The Confluence Detector finds exciting opportunities using Technical Confluences. The TC is a tool to locate and point out those price levels where there is a congestion of indicators, moving averages, Fibonacci levels, Pivot Points, etc. Knowing where these congestion points are located is very useful for the trader, and can be used as a basis for different strategies.
This tool assigns a certain amount of “weight” to each indicator, and this “weight” can influence adjacents price levels. This means that one price level without any indicator or moving average but under the influence of two “strongly weighted” levels accumulate more resistance than their neighbors. In these cases, the tool signals resistance in apparently empty areas.
