EUR/USD dropped to near 21-month lows as euro-zone and US data continued diverging, working in favor of the US Dollar. Ahead of further important figures today, the pair is on the edge, but resistance is slightly weaker than support, so there’s still a way out.
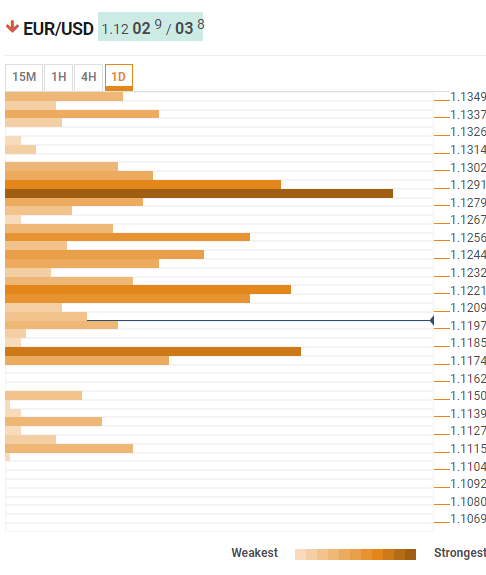
The Technical Confluences Indicator shows that the 21-month low of 1.1176 is also the confluence of the Pivot Point one-week Support 1, the PP one-day S2, and the Bollinger Band one-day Lower.
Resistance is also close and it is a bit softer. At 1.1221 we see a dense cluster of levels including the Fibonacci 23.6% one-day, the previous yearly low, the Simple Moving Average 100-15m, the SMA 10-4h, the BB 15min-Upper, the SMA 5-4h, the previous 4h-high, and the BB 1h-Middle.
Further above, significant resistance awaits at 1.1285 which is the convergence of the Fibonacci 161.8% one-day, the Fibonacci 38.2% one-month, the SMA 200-1h, the Fibonacci 61.8% one-week, the PP 1d-R3, and the BB 1d-Middle.
On the downside, the only noteworthy support area below 1.1176 is 1.1115 which is the PP one-month S1.
Here is how it looks on the tool:
Confluence Detector
The Confluence Detector finds exciting opportunities using Technical Confluences. The TC is a tool to locate and point out those price levels where there is a congestion of indicators, moving averages, Fibonacci levels, Pivot Points, etc. Knowing where these congestion points are located is very useful for the trader, and can be used as a basis for different strategies.
This tool assigns a certain amount of “weight” to each indicator, and this “weight” can influence adjacents price levels. These weightings mean that one price level without any indicator or moving average but under the influence of two “strongly weighted” levels accumulate more resistance than their neighbors. In these cases, the tool signals resistance in apparently empty areas.
