EUR/USD has been able to stabilize its losses as US bond yields dropped in response to US President Donald Trump announced new tariffs against China. However, the world’s most popular currency pair remains depressed below 1.1100. What’s next? The Non-Farm Payrolls report is eyed.
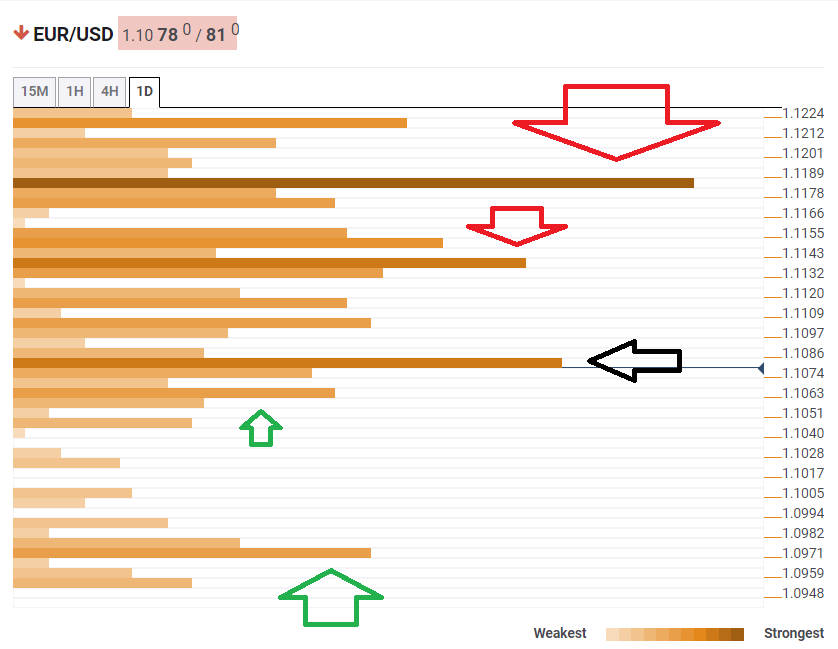
The Technical Confluences Indicator shows that EUR/USD is currently struggling around 1.1080 where we see the convergence of the Bollinger Band one-day-Lower, the Pivot Point one-week Support 1, the Simple Moving Average 5-15m, and the Fibonacci 23.6% one-day.
Looking up, significant resistance awaits at 1.1138 which is the meeting point of the SMA 200-1h, the Fibonacci 23.6% one-month, and the Fibonacci 23.6% one-week.
The next upside target awaits at 1.1183 which is the confluence of the Fibonacci 61.8% one-week, the Fibonacci 38.2% one-month, and the PP one-day Resistance 3.
Looking down, weak support awaits at 1.1063 where the Fibonacci 61.8% one-day meets the price.
However, more substantial support is only at 1.0971 where the PP 1d-S3 and the PP 1m-S1 converge.
Here is how it looks on the tool:
Confluence Detector
The Confluence Detector finds exciting opportunities using Technical Confluences. The TC is a tool to locate and point out those price levels where there is a congestion of indicators, moving averages, Fibonacci levels, Pivot Points, etc. Knowing where these congestion points are located is very useful for the trader, and can be used as a basis for different strategies.
This tool assigns a certain amount of “weight” to each indicator, and this “weight” can influence adjacents price levels. These weightings mean that one price level without any indicator or moving average but under the influence of two “strongly weighted” levels accumulate more resistance than their neighbors. In these cases, the tool signals resistance in apparently empty areas.
