USD/JPY has been on the back foot as trade have been intensifying and the yen enjoys safe-haven demand. What levels should we watch?
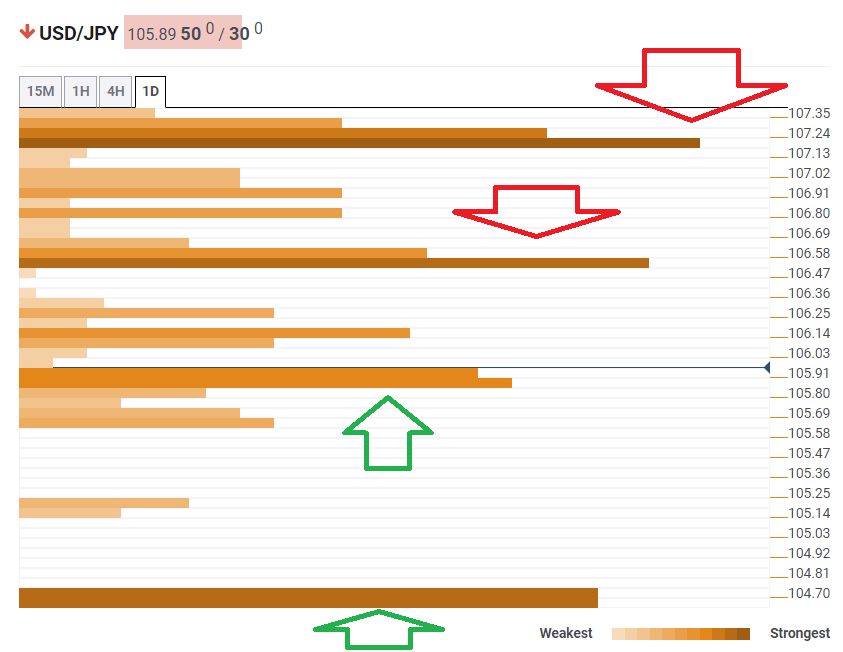
The Technical Confluences Indicator is showing that USD/JPY enjoys some support around 105.85 which is the convergence of the Pivot Point one-month Support 3, the Bollinger Band 1h-Lower, and the Pivot Point one-day Support 2.
Below, noteworthy support awaits only at 104.70 where last year’s low converges with the Pivot Point one-week Support 2.
Looking up, the pair may face resistance at 106.52 where we note the confluence of the Simple Moving Average 5-4h, the BB 1h-Middle, and the previous daily low.
Higher, the upside target is 107.18 where last month’s low, the Fibonacci 61.8% one-day, and the Fibonacci 23.6% one-week create a resistance.
Here is how it looks on the tool:
Confluence Detector
The Confluence Detector finds exciting opportunities using Technical Confluences. The TC is a tool to locate and point out those price levels where there is a congestion of indicators, moving averages, Fibonacci levels, Pivot Points, etc. Knowing where these congestion points are located is very useful for the trader, and can be used as a basis for different strategies.
This tool assigns a certain amount of “weight” to each indicator, and this “weight” can influence adjacents price levels. These weightings mean that one price level without any indicator or moving average but under the influence of two “strongly weighted” levels accumulate more resistance than their neighbors. In these cases, the tool signals resistance in apparently empty areas.
