AUD/USD has followed the lead of the New Zealand dollar and tumbled down, dropping to levels last seen in 2009. What is next for the currency of the land down under?
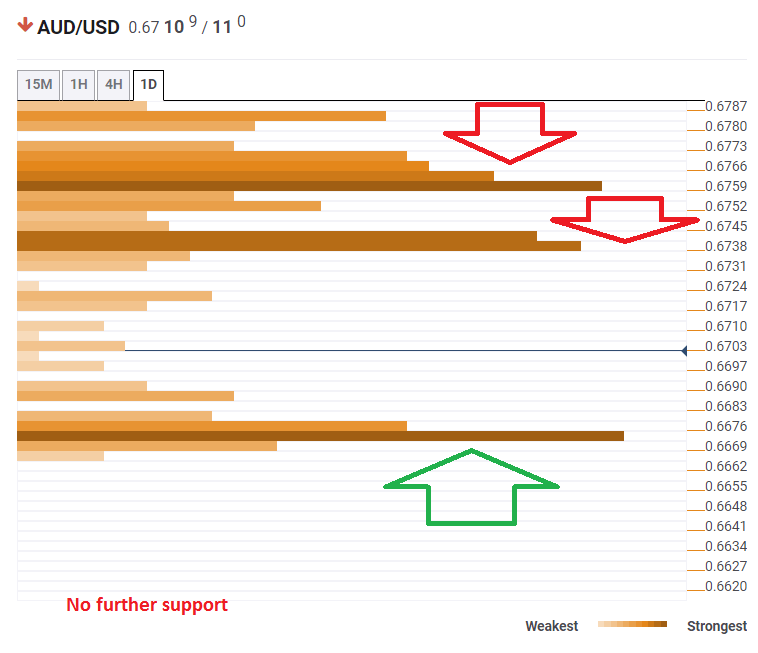
The Technical Confluences Indicator is showing that AUD/USD enjoys support at 0.6673 which is the convergence of the Pivot Point one-week Support 2, the PP one-month Support 2, and the Bollinger Band 15min-Lower.
Below, there are no additional support lines at least until 0.6620. It seems like the Aussie may free-fall if it loses 0.6673.
Looking up, resistance awaits at 0.6738 which is a dense cluster including the BB 15min-Middle, the Simple Moving Average 5-1h, the BB 1d-Lower, the PP 1d-S1, the PP 1w-S1, and more.
Further above, 0.6759 is the next cap. We see the SMA 5-4h, the PP 1m-S1, the BB 1h-Middle, the previous weekly low, and the SMA 100-15m.
Overall, AUD/USD remains vulnerable.
Here is how it looks on the tool:
Confluence Detector
The Confluence Detector finds exciting opportunities using Technical Confluences. The TC is a tool to locate and point out those price levels where there is a congestion of indicators, moving averages, Fibonacci levels, Pivot Points, etc. Knowing where these congestion points are located is very useful for the trader, and can be used as a basis for different strategies.
This tool assigns a certain amount of “weight” to each indicator, and this “weight” can influence adjacents price levels. These weightings mean that one price level without any indicator or moving average but under the influence of two “strongly weighted” levels accumulate more resistance than their neighbors. In these cases, the tool signals resistance in apparently empty areas.
