EUR/USD has been consolidating last week’s losses as a new week kicks off. Hopes for German fiscal stimulus have been unable to boost the common currency as trade uncertainty looms. The technical charts are unfavorable.
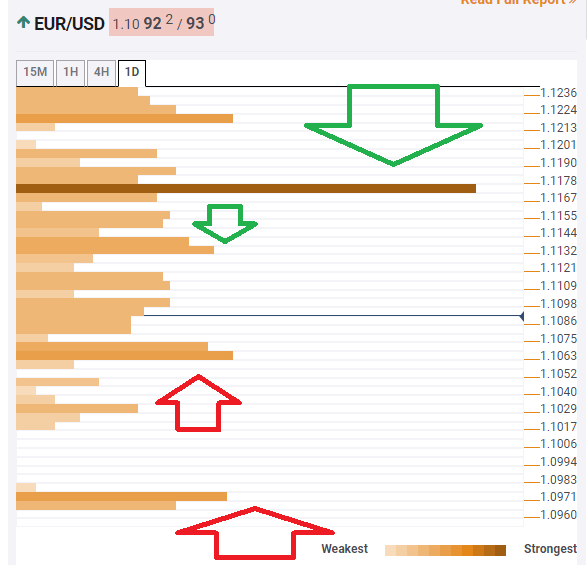
The Technical Confluences Indicator is showing that EUR/USD has weak support at 1.1063 which is the convergence of the Bollinger Band 4h-Lower, the previous monthly low, the Pivot Point one-day Support 1, and the BB 1d-Lower.
The next noteworthy cushion is only at 1.0971 where the PP 1m-S1 and the PP 1w-S2 meet.
Looking up, some resistance awaits at 1.1132, which is the confluence of the Fibonacci 38.2% one-week and the Fibonacci 23.6% one-month.
A significant cap awaits EUR/USD at 1.1173, where we see a dense cluster of lines including the Fibonacci 61.8% one-week, the Simple Moving Average 50-4h, the SMA 200-1h, the SMA 10-1d, the PP one-day R3, and more.
All in all, the path of least resistance is down.
Here is how it looks on the tool:
Confluence Detector
The Confluence Detector finds exciting opportunities using Technical Confluences. The TC is a tool to locate and point out those price levels where there is a congestion of indicators, moving averages, Fibonacci levels, Pivot Points, etc. Knowing where these congestion points are located is very useful for the trader, and can be used as a basis for different strategies.
This tool assigns a certain amount of “weight” to each indicator, and this “weight” can influence adjacents price levels. These weightings mean that one price level without any indicator or moving average but under the influence of two “strongly weighted” levels accumulate more resistance than their neighbors. In these cases, the tool signals resistance in apparently empty areas.
