Technical lines from top to bottom:
We start with resistance at 1.4029.
1.3860 is next.
GBP/USD posted considerable losses, erasing the gains seen the week before. The upcoming week has four releases, including GDP. Here is an outlook for the highlights and an updated technical analysis for GBP/USD.
UK PMIs were a mixed bag in December. Manufacturing remains strong, as the PMI accelerated to 57.5, up from 55.6 beforehand. This was the highest level since November 2017. Services PMI has slipped into contraction territory and came in at 49.4, below the neutral 50-level. Construction also remains in expansionary territory and came in at 54.6 points.
.
GBP/USD daily graph with resistance and support lines on it. Click to enlarge: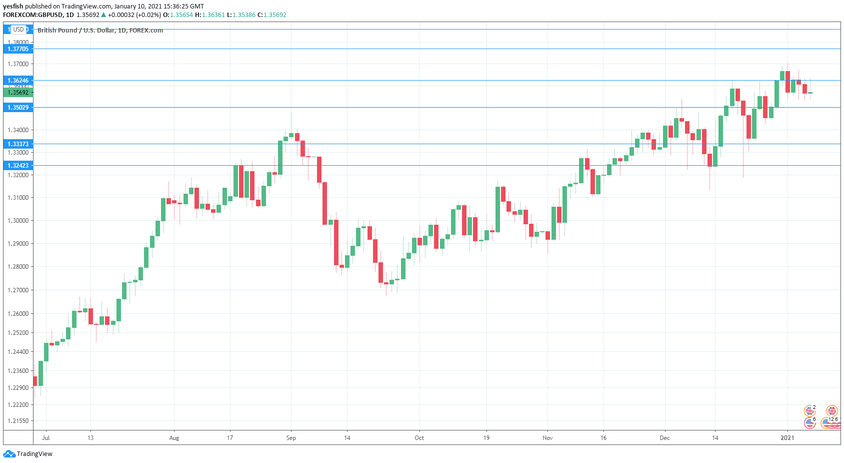
GBP/USD Technical Analysis
Technical lines from top to bottom:
We start with resistance at 1.4029.
1.3860 is next.
1.3769 has held in resistance since May 2018.
1.3624 has switched to a support role after GBP/USD lost ground last week.
1.3502 (mentioned last week) is providing support.
1.3336 is next.
1.3243 is the final support level for now.
.
I am neutral on GBP/USD
The US dollar is showing signs of stabilizing, but it’s unclear if the currency will rebound after months of decline. The UK economy is in for a tough time, as the UK is enduring its third Covid lockdown.
Further reading:
Safe trading!
