- TheGraph price is contained inside a parallel channel on the 4-hour chart.
- A key indicator has just presented a sell signal for GRT.
- A significant number of whales have sold their GRT holdings in the past two weeks.
TheGraph price has been trading inside a defined range between $2 and $1.4 for the past week and a half. However, it seems that bears have the upper hand in the short-term.
TheGraph price faces strong selling pressure due to whales
GRT seems to be facing a lot of selling pressure in the short-term as a large portion of whales holding at least 10,000,000 coins have exited the market. Since February 21, the number of these large holders dropped from 115 to 108 currently.

GRT Holders Distribution
Besides the pressure from the whales, the TD Sequential indicator has also just presented a sell signal on the 4-hour chart, right at the top of a parallel channel. TheGraph price could quickly drop towards $1.44, a 25% move.
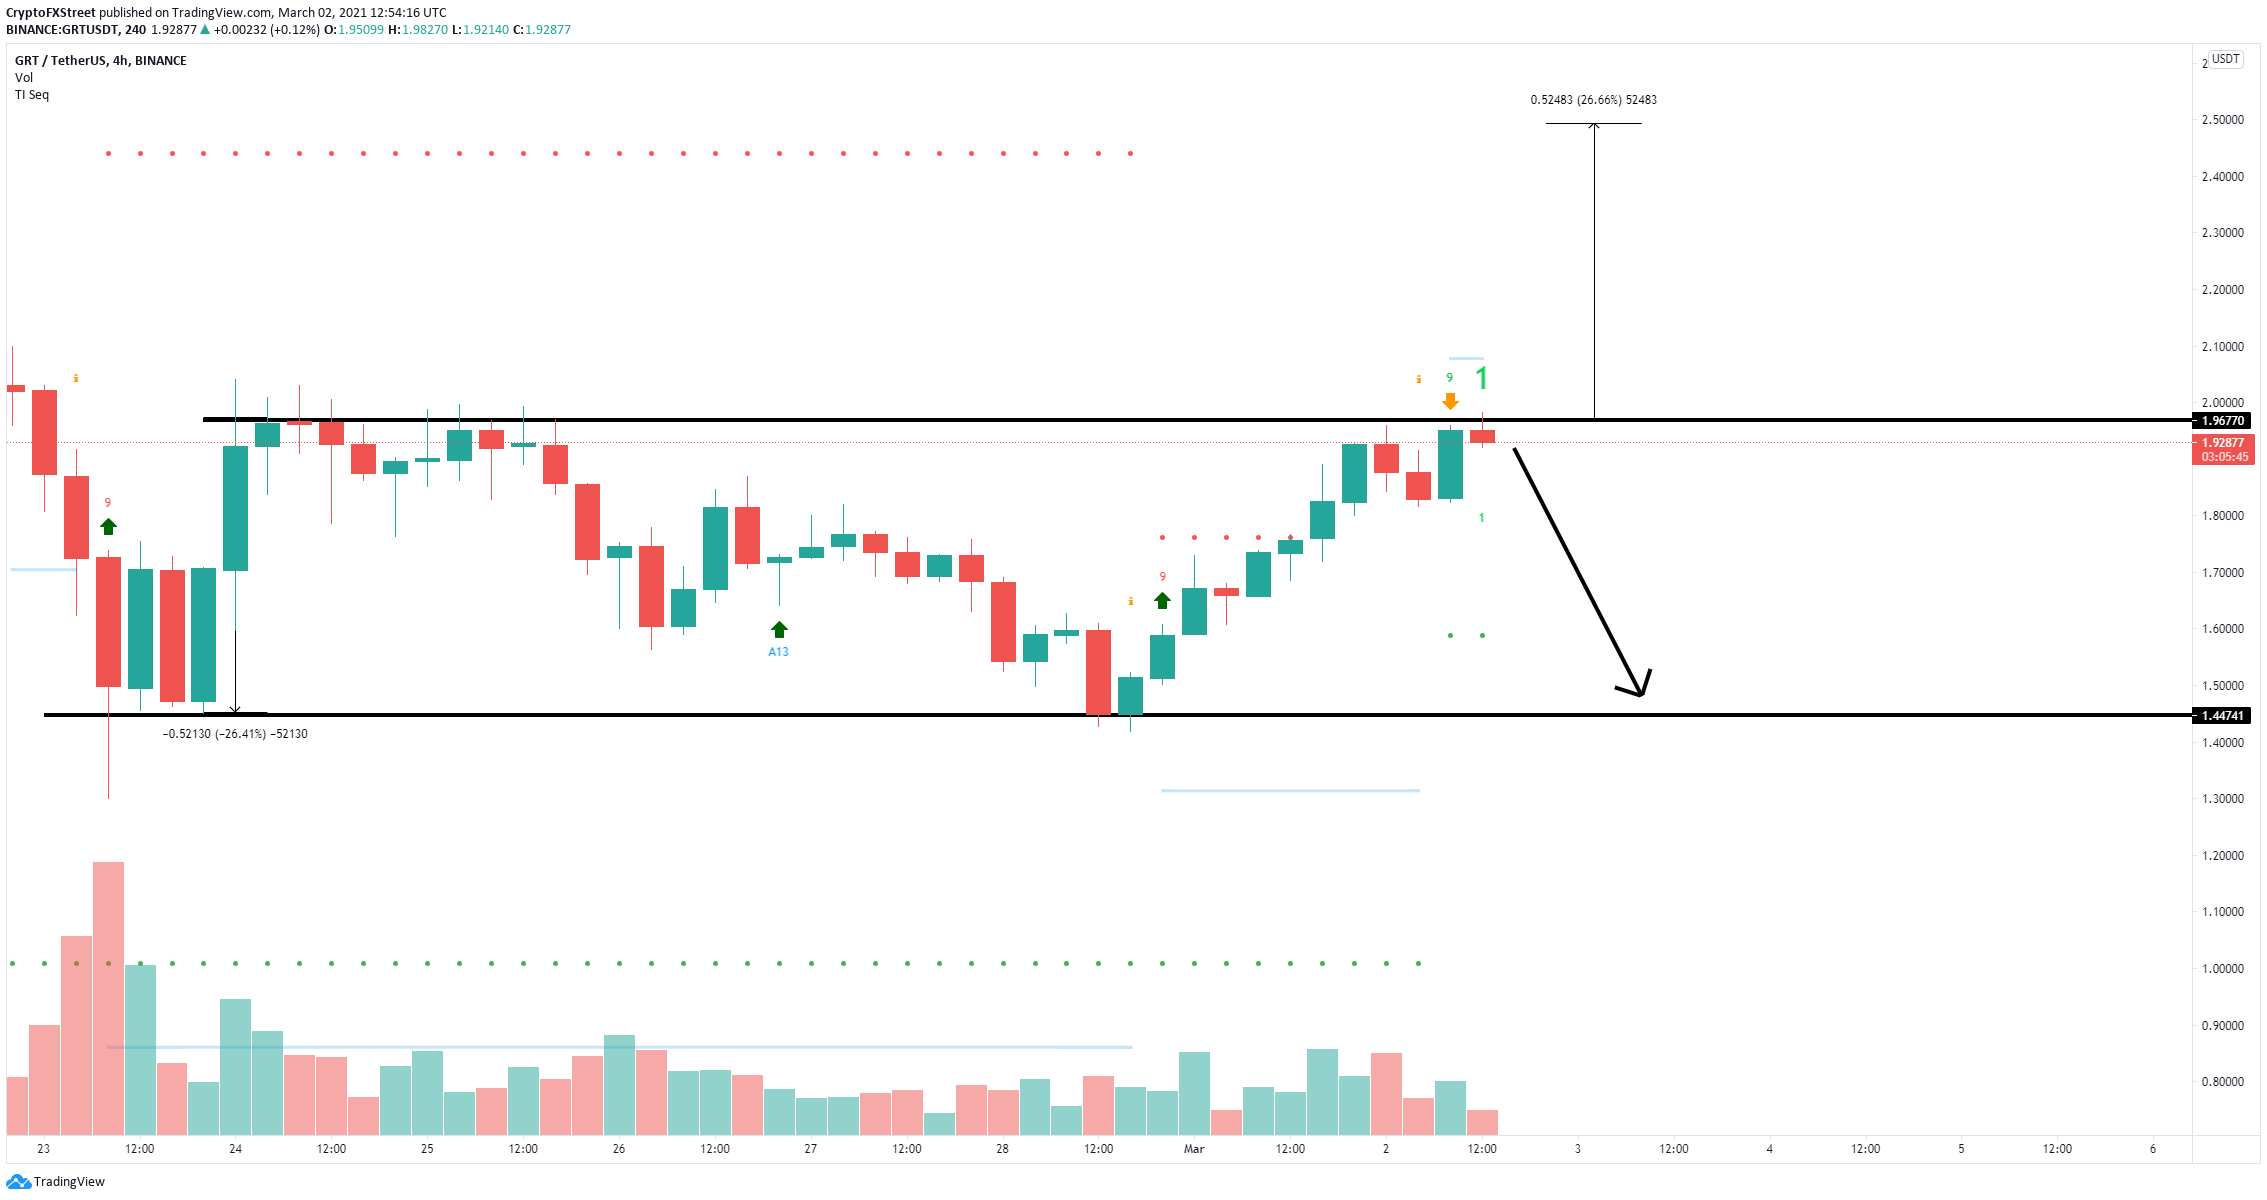
GRT/USD 4-hour chart
On the flip side, the only hope for the bulls is to push TheGraph price above $2 to invalidate the sell signal and confirm a breakout above the parallel channel. This move would have a price target of $2.5.
 Share