- Australia’s headline inflation figure rose by 3.4% in February.
- The chances of an RBA rate cut in August have risen to 68%.
- There is a 71% chance that the Fed will start cutting interest rates in June.
Today’s AUD/USD price analysis shows a slight bearish tilt following the release of data showing Australia’s inflation missed forecasts. This revelation has sparked speculation that the Reserve Bank of Australia might be inclined to initiate rate cuts as early as August.
-Are you interested in learning about the best AI trading forex brokers? Click here for details-
Australia’s headline inflation figure rose by 3.4% in February, holding steady from January. Meanwhile, economists had expected inflation to rise by 3.5%. However, underlying inflation remained high, showing inflation was still persistent. As a result, the Australian dollar fell briefly before recovering.
The Reserve Bank of Australia recently assumed a less hawkish stance due to the decline in inflation. Moreover, Australia’s economy has slowed down due to the high-interest rates. As a result, the chances of an RBA rate cut in August have risen to 68%. Still, this would put the RBA among the last major central banks to hike. Therefore, it gives the Australian dollar an edge over its peers.
Notably, there is a 71% chance that the Fed will start cutting interest rates in June. This is much earlier than the RBA. However, the dollar has remained strong as data contradicts the rate-cut outlook. Although Powell maintains that the Fed will cut rates three times this year, data on inflation and economic performance suggest otherwise. Consequently, there is a bit of uncertainty regarding the rate-cut outlook.
AUD/USD key events today
Traders will keep absorbing Australia’s CPI report as there are no more key events scheduled for today.
AUD/USD technical price analysis: Price retreats after failed 30-SMA break
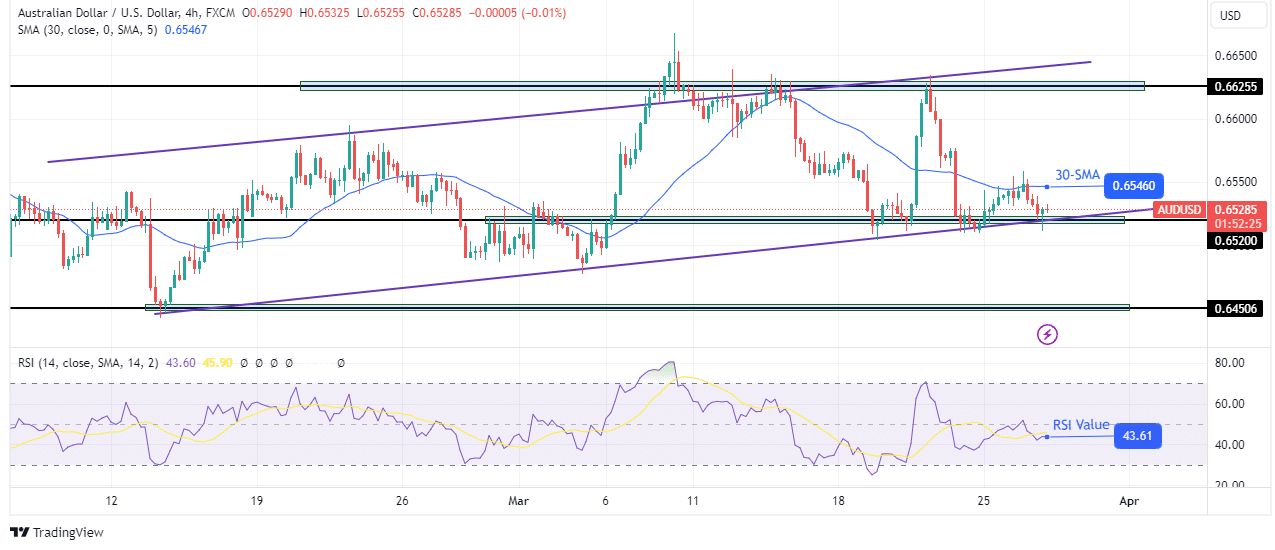
On the technical side, AUD/USD bounced lower after failing to break above the 30-SMA. At the same time, the RSI respected the 50 mark as resistance and bounced lower. This is a sign that bears are not ready to give up control. However, bears have also weakened as the price is now making small-bodied candles.
-Are you interested in learning about the forex indicators? Click here for details-
Moreover, the decline has failed to break below a solid support zone comprising the 0.6520 key level and its bullish channel support. The price bounces higher every time it gets to this zone. Therefore, there is a high chance that bulls will soon retest the 30-SMA with the aim of breaking above and retesting the channel resistance.
Looking to trade forex now? Invest at eToro!
68% of retail investor accounts lose money when trading CFDs with this provider. You should consider whether you can afford to take the high risk of losing your money.
